産業調査:接着剤市場の展望(2024-2034年)~市場規模、推進要因、阻害要因~30カ国以上をカバーする世界市場分析

※本ページに記載されている内容は英文レポートの概要と目次を日本語に自動翻訳したものです。英文レポートの情報と購入方法はお問い合わせください。
*** 本調査レポートに関するお問い合わせ ***
自動車、建築などいくつかの最終用途産業において、効率的で高性能な接着剤への嗜好が高まっており、その結果、世界の接着剤市場は2024年から2034年まで年平均成長率5%で着実に拡大している。2024年の市場規模は689億4,000万米ドルで、2034年末には1,122億9,000万米ドルに達すると予測されている。
自動車産業、履物産業、木工産業、包装産業、建設産業など、さまざまな用途で接着剤の使用が増加していることが、市場の成長に寄与していると推定される。自動車業界は一貫して、CO2排出量を最小限に抑えることができる低燃費で軽量な自動車の設計を重視している。また、CO2排出に関する厳しい規制が実施されていることも、自動車用接着剤の需要にプラスの影響を与えている。さらに、接着剤の効果的な接着機能も、最終用途産業における需要を牽引している。
接着剤は、接合部のひずみや応力の均一な分布を改善し、大きな荷重に耐えることができる。接着剤は、締結要素、リベット、穴が存在しないため、材料の強度と完全性を維持するのに役立ちます。
履物・皮革製品に使用される接着剤の世界需要は、年平均成長率5.3%で増加し、2034年には219億米ドルに達すると予測されている。
2034年の予測期間終了時には、東アジアが世界市場の24.6%のシェアを占めると予測されている。
日本における接着剤の売上は、2024年から2034年にかけて年平均成長率5.2%で増加すると予測される。
建設業界では、接着剤は接着、クラックシール、ウェザーシール、防水など、さまざまな用途で幅広く使用されている。また、医療業界では、医療機器のさまざまな種類の部品を組み立てるなど、多目的に採用されている。さらに、世界中で医療費が増加していることから、必要な設備や道具の需要が高まり、今後10年間の接着剤需要に好影響を与えると予想されている。
接着剤の消費拡大にプラスの影響を与えているものは何か?
“持続可能で無害な接着剤の出現”
社会意識の高まりと環境規制が、グリーンで無害な持続可能なシーリング材や接着剤を開発しようとする市場の有力メーカーを刺激している。主要な市場プレイヤーの中には、接着剤として建築製品に使用するホルムアルデヒドを添加しない持続可能な接着剤を提供しているところもある。そのため、環境に優しい材料の使用に関する社会的意識の高まりが、持続可能で無害な接着剤の生産につながっており、市場プレイヤーに有益な機会を提供することが期待されている。
「拡大する建設産業が接着剤の高い需要を牽引”
様々な先進国や潜在的な高成長国における建設活動の増加は、住宅装飾や高度な建築に対する要求の高まりにつながっている。その結果、住宅だけでなく非住宅分野からもこれらの材料に対する需要が高まると予想される。さらに、新規および既存プロジェクトに対する政府支出の増加が、製品需要の増加による接着剤市場規模の拡大をもたらすと予想される。
接着剤市場の成長を阻む主な障害は?
“厳しい環境規制の実施”
接着剤の消費量の増加は、吸入すると有害で有害な化学ガスの放出につながる。そのため、人間と環境の健康を考慮した厳しい規則が課されている。こうした環境対策は、接着剤の需要に悪影響を与えると予想される。
新規参入企業が市場でのポジションを強化する接着剤市場のトレンドとは?
“バイオ接着剤開発のための研究開発投資”
厳しい環境政策の実施により、新興企業はバイオベースの代替品開発への投資拡大に注力している。植物油ベースのポリアミド、エポキシ、ポリイソプレン、大豆由来のポリオールなどは、販売と生産が増加しているバイオベースの接着剤である。
国別インサイト
Fact.MRのレポートによると、東アジアは2034年までに世界市場の24.6%のシェアを占めると予測されている。自動車に対する要求の増加とともに、産業支出の増加が接着剤の需要を高めている。同地域では、建築・建設プロジェクトの増加が接着剤需要を牽引している。
米国の市場シナリオは?
「接着剤需要を牽引する著名な最終用途産業の存在
米国は2034年末までに北米市場で73.5%のシェアを占めると予測されている。同国では建設プロジェクトや複合ジョイントの需要が増加しており、接着剤の応用範囲が広がると推定される。さらに、石油由来の化学物質の効果的な代替品として再生可能資源の開発が進んでいることも、同国における市場機会の拡大に寄与している。さらに、エレクトロニクス、自動車、建設など、いくつかの著名な最終用途産業の存在は、接着剤の適用範囲を広げると予測されている。
接着剤の主要市場は東アジアのどの国か?
“中国における著名製造工場の設立”
中国は、2034年末までに東アジア市場で57.3%のシェアを獲得すると予想されている。中国で積極的に操業し、生産能力の増強に投資している製造工場もあり、収益源に貢献している。加えて、より効果的な接着剤を製造するための研究開発活動への投資が増加していることも、中国での地位強化に貢献している。
カテゴリー別インサイト
市場調査および競合情報提供会社であるFact.MRの改訂版レポートによると、反応性接着剤の世界需要は年平均成長率5.1%で増加し、2034年末までに148億9000万米ドルの市場規模に達すると予測されている。このタイプの接着剤の高い強度と効率的な接着特性により、世界中で需要が増加している。
他と比較してどのタイプの接着剤が多く使われているか?
「反応性接着剤による接着特性の向上
反応性接着剤は、2034年末までに接着剤市場シェアの21.8%を占めると予測されている。反応性接着剤の使用の増加は、ハイテク機器などを含む基板に高い強度と永続性を提供する能力に起因している。それらは、熱、湿気、および化学薬品に対する耐性を提供するために基板間に永久的な結合を形成する能力によって特徴付けられる。
靴と皮革製品における責任ある高接着剤使用とは?
“接着剤の優れた耐性と耐久性が需要を牽引”
フットウェアと革製品は、2034年末までに世界市場収益シェアの19.5%を占めると予測されている。様々なタイプの履物に接着剤の使用が増加しているのは、湿気、衝撃、極端な温度、振動に優れた耐性を提供するその機能に起因している。これらは、いくつかの例外的な老化特性を持つ強力な耐水性結合を提供します。同様に、さまざまなタイプの革製品における接着剤は、高い構造的性能のために耐久性と製品性能を向上させるために使用されます。さらに、美観を保つために使用されることも、それぞれの業界における需要を牽引している。
競争環境
著名な市場関係者は、接着剤を重要なコンポーネントの1つとして採用する最終用途産業の要件に適合させるため、研究開発活動に注力している。世界市場の各企業は、新製品の開発、サプライ・チェーン・システムの強化、高品質な製品の提供に取り組んでいる。
例えば:
2020年1月、GEシーラント&アドヒーシブズは、バス&キッチン、ドア&窓、塗装&シーリングなど、住宅の外部および内部のリフォームで使用される塗料を保護するコーキング剤およびシーリング剤の斬新な製品ラインを発表した。
Bostik社は、工業、建設、消費者市場向けの接着剤で人気のスペシャリストの1つである。2019年9月、同社は背中の寝具に使用する革新的な改質シリコーンシーラントを発売した。
接着剤市場の主要企業には、H.B. Fuller Company、3M、Wacker Chemie AG、Arkema S.A.、Sika AG、Henkel Corporation、Ashland Inc.、RPM International Inc.、Avery Dennison、PPG Industries、BASF SE、Evonik Industriesなどがある。
接着剤市場調査のセグメンテーション
種類別 :
水性
溶剤ベース
ホットメルト
反応性
感圧接着剤(PSA)
用途別 :
パッケージング
建築/建設
交通
フットウェア&レザーグッズ
製品組立
コンシューマー/DIYアプリケーション
製品別:
アクリル系
エポキシ系
ポリ酢酸ビニル(PVA)ベース
ポリウレタン(PU)ベース
スチレン系ブロックベース
地域別 :
北米
ヨーロッパ
東アジア
ラテンアメリカ
中東・アフリカ
南アジア・オセアニア
– よくある質問
2024年の接着剤市場規模は?
世界の接着剤市場は、2024年には689億4000万米ドルに達する見通しである。
2034年の接着剤の需要見通しは?
接着剤の世界需要は、2034年までに1,122億9,000万米ドルの市場規模に達すると予測されている。
世界市場の予想成長率は?
世界市場は2024年から2034年まで年平均成長率5%で拡大すると予測されている。
世界市場の収益に対する東アジアの貢献度は?
東アジアは2034年までに世界市場の24.6%のシェアを占めると予測されている。
韓国における接着剤の売上高は、年平均成長率(CAGR)でどのくらい上昇すると予測されますか?
韓国における接着剤の売上高は、2024年から2034年にかけて年平均成長率7.8%で増加すると予測されている。
反応性接着剤の市場シナリオは?
反応性接着剤の需要は年平均成長率5.1%で増加し、2034年には244.8億米ドルに達すると予想される。
フットウェア&レザー部門は世界市場でどれくらいのシェアを占めると予測されるか?
フットウェア&レザー分野は、2034年までに世界市場シェアの19.5%を占めると評価されている。
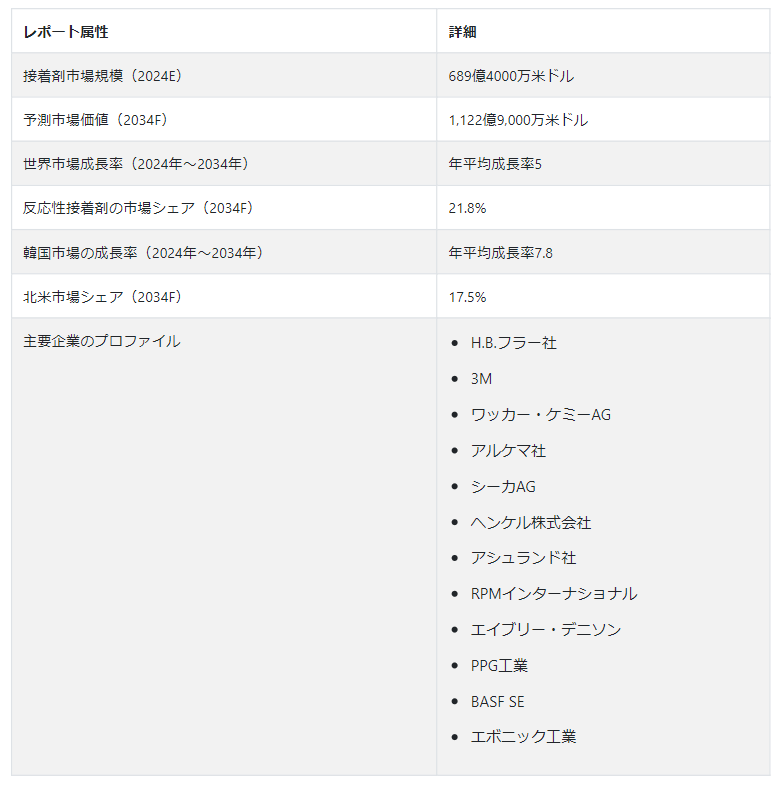
Table of Content
1. Executive Summary
1.1. Summary of Key Findings
1.2. Summary of Statistics
1.3. Fact.MR Analysis and Recommendations
2. Market Overview
2.1. Market Coverage / Taxonomy
2.2. Market Definition / Scope / Limitations
3. Market Risks & Trends Assessment
3.1. Risk Assessment
3.1.1. COVID-19 Crisis and Impact on Production
3.1.2. COVID-19 Crisis and Impact on Prices
3.1.3. COVID-19 Impact Benchmark with Previous Crisis
3.1.3.1. Change in Demand and Consumption Growth
3.1.3.2. Before and After COVID-19 Crisis (Projected)
3.1.3.3. Before and After Sub-prime Crisis – 2008 (Actual)
3.1.3.4. Change in Demand post Recovery Period (After Each Crisis)
3.1.4. Impact on Market Volume (Tons) and Value (US$ Mn)
3.1.4.1. Likely Loss of Value in 2022
3.1.4.2. Mid-term and Long Term Forecast
3.1.4.3. Quarter by Quarter Demand and Recovery Assessment
3.1.5. Anticipated Demand and Value Recovery Curve
3.1.5.1. Likelihood of U-Shape Recovery
3.1.5.2. Likelihood of L-Shape Recovery
3.1.6. Recovery Period Assessment by Key Countries
3.1.7. Recovery Assessment by Key Market Segments
3.1.8. Action Points and Recommendation for Suppliers
3.1.9. Impact on Trade Balance
3.2. Key Trends Impacting the Market
3.3. Formulation and Product Development Trends
4. Market Background and Foundation Data Points
4.1. Global Chemical Industry Overview
4.1.1. Chemical Industry, by Region
4.1.2. Chemical Industry, by Competition
4.2. Investments in Chemical Industry
4.3. Global Chemical Industry Outlook
4.4. Adhesives: Application Mapping
4.5. Detailed Use Cases of Across Major Industries
4.6. Raw Material Sourcing & Strategy
4.7. Macro-Economic Factors
4.7.1. Global GDP Growth Outlook
4.7.2. Chemicals Industry Growth Outlook
4.7.3. Fluctuation in Raw Material Prices
4.7.4. Others
4.8. Forecast Factors – Relevance & Impact
4.8.1. Top Companies Historical Growth
4.8.2. Application Growth
4.8.3. Investments in Production Technology
4.8.4. Planned Expansions
4.8.5. Impact of COVID-19 in Short Term Forecast
4.8.6. Others
4.9. Market Dynamics
4.9.1. Drivers
4.9.2. Restraints
4.9.3. Opportunity Analysis
4.10. Scenario Forecast (Demand in optimistic, likely, and conservative market conditions)
4.11. Investment feasibility Analysis
4.12. Policy and Regulatory Landscape
4.13. PESTLE and Porter Analysis
4.14. Value Chain Analysis
4.14.1. Operating Margins (at each node of value chain)
4.14.2. Key Manufacturers
4.14.3. Key Distributor/Retailers
4.14.4. Key Buying Industries
5. Key Success Factors
5.1. Advancement in Production Technology
5.2. Acquisitions by Key Competitors
5.3. Expansion of Product Portfolios
5.4. Bundled Product Offerings on the basis of Application
5.5. Strengthening Presence through Establishment of New Branches
5.6. Others (Discussed in Report)
6. Global Market Volume Demand (Tons) Analysis 2018-2023 and Forecast, 2024-2034
6.1. Historical Market Volume (Tons) Analysis, 2018-2023
6.2. Current and Future Market Volume (Tons) Projections, 2024-2034
6.3. Y-o-Y Growth Trend Analysis
7. Global Market – Pricing Analysis
7.1. Regional Pricing Analysis
7.2. Price Variance By Product
7.3. Price Evolution and Projection
7.4. Pricing Break-up and Margins
7.5. Global Average Pricing Analysis Benchmark
8. Global Market Value Analysis 2018-2023 and Forecast, 2024-2034
8.1. Historical Market Value (US$ Mn) Analysis, 2018-2023
8.2. Current and Future Market Value (US$ Mn) Projections, 2024-2034
8.2.1. Y-o-Y Growth Trend Analysis
8.2.2. Absolute $ Opportunity Analysis
9. Global Market Analysis 2018-2023 and Forecast 2024-2034, By Product
9.1. Introduction / Key Findings
9.2. Historical Market Size (US$ Mn) and Volume (Tons) Analysis By Type, 2018-2023
9.3. Current and Future Market Size (US$ Mn) and Volume (Tons) Analysis and Forecast By Type, 2024-2034
9.3.1. Acrylic
9.3.2. Epoxy
9.3.3. Polyurethane
9.3.4. Styrenic Block
9.3.5. Polyvinyl Acetate (PVA)
9.3.6. Ethyl Vinyl Acetate (EVA)
9.3.7. Sillicone & Others
9.4. Market Attractiveness Analysis By Type
10. Global Market Analysis 2018-2023 and Forecast 2024-2034, By End-Use
10.1. Introduction / Key Findings
10.2. Historical Market Size (US$ Mn) and Volume (Tons) Analysis By Application, 2018-2023
10.3. Current and Future Market Size (US$ Mn) and Volume (Tons) Analysis and Forecast By Application, 2024-2034
10.3.1. Paper & Packaging
10.3.2. Automotive & Transportation
10.3.3. Building & Construction
10.3.4. Woodworking
10.3.5. Consumer/DIY
10.3.6. Leather & Footwear
10.3.7. Others
10.4. Market Attractiveness Analysis By End-Use
11. Global Market Analysis 2018-2023 and Forecast 2024-2034, By Type
11.1. Introduction / Key Findings
11.2. Historical Market Size (US$ Mn) and Volume (Tons) Analysis By Product, 2018-2023
11.3. Current and Future Market Size (US$ Mn) and Volume (Tons) Analysis and Forecast By Product, 2024-2034
11.3.1. Water-based
11.3.2. Solvent-based
11.3.3. Hot Melt
11.3.4. Reactive
11.3.5. PSA
11.3.6. Others
11.4. Market Attractiveness Analysis By Type
12. Global Market Analysis 2018-2023 and Forecast 2024-2034, by Region
12.1. Introduction
12.2. Historical Market Size (US$ Mn) and Volume (Tons) Analysis By Region, 2018-2023
12.3. Current Market Size (US$ Mn) and Volume (Tons) Analysis and Forecast By Region, 2024-2034
12.3.1. North America
12.3.2. Latin America
12.3.3. Europe
12.3.4. Asia Pacific
12.3.5. Middle East and Africa (MEA)
12.4. Market Attractiveness Analysis By Region
13. North America Market Analysis 2018-2023 and Forecast 2024-2034
13.1. Introduction
13.2. Pricing Analysis
13.3. Historical Market Size (US$ Mn) and Volume (Tons) Trend Analysis By Market Taxonomy, 2018-2023
13.4. Market Size (US$ Mn) and Volume (Tons) Forecast By Market Taxonomy, 2024-2034
13.4.1. By Country
13.4.1.1. U.S.
13.4.1.2. Canada
13.4.2. By Product
13.4.3. By End-use
13.4.4. By Type
13.5. Market Attractiveness Analysis
13.5.1. By Country
13.5.2. By Type
13.5.3. By Product
13.5.4. By End-use
13.5.5. By Type
14. Latin America Market Analysis 2018-2023 and Forecast 2024-2034
14.1. Introduction
14.2. Pricing Analysis
14.3. Historical Market Size (US$ Mn) and Volume (Tons) Trend Analysis by Market Taxonomy, 2018-2023
14.4. Market Size (US$ Mn) and Volume (Tons) Forecast By Market Taxonomy, 2024-2034
14.4.1. By Country
14.4.1.1. Brazil
14.4.1.2. Mexico
14.4.1.3. Rest of Latin America
14.4.2. By Product
14.4.3. By End-use
14.4.4. By Type
14.5. Market Attractiveness Analysis
14.5.1. By Country
14.5.2. By Product
14.5.3. By End-use
14.5.4. By Type
15. Europe Market Analysis 2018-2023 and Forecast 2024-2034
15.1. Introduction
15.2. Pricing Analysis
15.3. Historical Market Size (US$ Mn) and Volume (Tons) Trend Analysis by Market Taxonomy, 2018-2023
15.4. Market Size (US$ Mn) and Volume (Tons) Forecast By Market Taxonomy, 2024-2034
15.4.1. By Country
15.4.1.1. Germany
15.4.1.2. United Kingdom
15.4.1.3. France
15.4.1.4. Italy
15.4.1.5. Spain
15.4.1.6. BENELUX
15.4.1.7. NORDIC
15.4.1.8. Russia
15.4.1.9. Poland
15.4.1.10. Rest of Europe
15.4.2. By Product
15.4.3. By End-Use
15.4.4. By Type
15.5. Market Attractiveness Analysis
15.5.1. By Country
15.5.2. By Product
15.5.3. By End-Use
15.5.4. By Type
16. Asia Pacific Market Analysis 2018-2023 and Forecast 2024-2034
16.1. Introduction
16.2. Pricing Analysis
16.3. Historical Market Size (US$ Mn) and Volume (Tons) Trend Analysis By Market Taxonomy, 2018-2023
16.4. Market Size (US$ Mn) and Volume (Tons) Forecast By Market Taxonomy, 2024-2034
16.4.1. By Country
16.4.1.1. China
16.4.1.2. Japan
16.4.1.3. India
16.4.1.4. ASEAN
16.4.1.5. Australia & New Zealand
16.4.1.6. Rest of APAC
16.4.2. By Product
16.4.3. By End-use
16.4.4. By Type
16.5. Market Attractiveness Analysis
16.5.1. By Country
16.5.2. By Product
16.5.3. By End-Use
16.5.4. By Type
17. Middle East and Africa Market Analysis 2018-2023 and Forecast 2024-2034
17.1. Introduction
17.2. Pricing Analysis
17.3. Historical Market Size (US$ Mn) and Volume (Tons) Trend Analysis By Market Taxonomy, 2018-2023
17.4. Market Size (US$ Mn) and Volume (Tons) Forecast By Market Taxonomy, 2024-2034
17.4.1. By Country
17.4.1.1. GCC Countries
17.4.1.2. South Africa
17.4.1.3. Northern Africa
17.4.1.4. Turkey
17.4.1.5. Rest of Middle East and Africa
17.4.2. By Product
17.4.3. By End-use
17.4.4. By Type
17.5. Market Attractiveness Analysis
17.5.1. By Product
17.5.2. By End-Use
17.5.3. By Type
18. Key Countries Market Analysis 2018-2023 and Forecast 2024-2034
18.1. Introduction
18.1.1. Market Value Proportion Analysis, By Key Countries
18.1.2. Global Vs. Country Growth Comparison
18.2. US Market Analysis
18.2.1. Value Proportion Analysis by Market Taxonomy
18.2.2. Volume (Tons), Value Analysis and Forecast by Market Taxonomy, 2018-2034
18.2.2.1. By Product
18.2.2.2. By End-use
18.2.2.3. By Type
18.2.3. Competition Landscape and Player Concentration in the Country
18.3. Canada Market Analysis
18.3.1. Value Proportion Analysis by Market Taxonomy
18.3.2. Volume (Tons), Value Analysis and Forecast by Market Taxonomy, 2018-2034
18.3.2.1. By Product
18.3.2.2. By End-use
18.3.2.3. By Type
18.3.3. Competition Landscape and Player Concentration in the Country
18.4. Mexico Market Analysis
18.4.1. Value Proportion Analysis by Market Taxonomy
18.4.2. Volume (Tons), Value Analysis and Forecast by Market Taxonomy, 2018-2034
18.4.2.1. By Product
18.4.2.2. By End-use
18.4.2.3. By Type
18.4.3. Competition Landscape and Player Concentration in the Country
18.5. Brazil Market Analysis
18.5.1. Value Proportion Analysis by Market Taxonomy
18.5.2. Volume (Tons), Value Analysis and Forecast by Market Taxonomy, 2018-2034
18.5.2.1. By Product
18.5.2.2. By End-use
18.5.2.3. By Type
18.5.3. Competition Landscape and Player Concentration in the Country
18.6. Germany Market Analysis
18.6.1. Value Proportion Analysis by Market Taxonomy
18.6.2. Volume (Tons), Value Analysis and Forecast by Market Taxonomy, 2018-2034
18.6.2.1. By Product
18.6.2.2. By End-use
18.6.2.3. By Type
18.6.3. Competition Landscape and Player Concentration in the Country
18.7. France Market Analysis
18.7.1. Value Proportion Analysis by Market Taxonomy
18.7.2. Volume (Tons), Value Analysis and Forecast by Market Taxonomy, 2018-2034
18.7.2.1. By Product
18.7.2.2. By End-use
18.7.2.3. By Type
18.7.3. Competition Landscape and Player Concentration in the Country
18.8. UK Market Analysis
18.8.1. Value Proportion Analysis by Market Taxonomy
18.8.2. Volume (Tons), Value Analysis and Forecast by Market Taxonomy, 2018-2034
18.8.2.1. By Product
18.8.2.2. By End-use
18.8.2.3. By Type
18.8.3. Competition Landscape and Player Concentration in the Country
18.9. Italy Market Analysis
18.9.1. Value Proportion Analysis by Market Taxonomy
18.9.2. Volume (Tons), Value Analysis and Forecast by Market Taxonomy, 2018-2034
18.9.2.1. By Product
18.9.2.2. By End-use
18.9.2.3. By Type
18.9.3. Competition Landscape and Player Concentration in the Country
18.10. Spain Market Analysis
18.10.1. Value Proportion Analysis by Market Taxonomy
18.10.2. Volume (Tons), Value Analysis and Forecast by Market Taxonomy, 2018-2034
18.10.2.1. By Product
18.10.2.2. By End-use
18.10.2.3. By Type
18.10.3. Competition Landscape and Player Concentration in the Country
18.11. Russia Market Analysis
18.11.1. Value Proportion Analysis by Market Taxonomy
18.11.2. Volume (Tons), Value Analysis and Forecast by Market Taxonomy, 2018-2034
18.11.2.1. By Product
18.11.2.2. By End-use
18.11.2.3. By Type
18.11.3. Competition Landscape and Player Concentration in the Country
18.12. China Market Analysis
18.12.1. Value Proportion Analysis by Market Taxonomy
18.12.2. Volume (Tons), Value Analysis and Forecast by Market Taxonomy, 2018-2034
18.12.2.1. By Product
18.12.2.2. By End-use
18.12.2.3. By Type
18.12.3. Competition Landscape and Player Concentration in the Country
18.13. Japan Market Analysis
18.13.1. Value Proportion Analysis by Market Taxonomy
18.13.2. Volume (Tons), Value Analysis and Forecast by Market Taxonomy, 2018-2034
18.13.2.1. By Product
18.13.2.2. By End-use
18.13.2.3. By Type
18.13.3. Competition Landscape and Player Concentration in the Country
18.14. South Korea Market Analysis
18.14.1. Value Proportion Analysis by Market Taxonomy
18.14.2. Volume (Tons), Value Analysis and Forecast by Market Taxonomy, 2018-2034
18.14.2.1. By Product
18.14.2.2. By End-use
18.14.2.3. By Type
18.14.3. Competition Landscape and Player Concentration in the Country
18.15. Australia Market Analysis
18.15.1. Value Proportion Analysis by Market Taxonomy
18.15.2. Volume (Tons), Value Analysis and Forecast by Market Taxonomy, 2018-2034
18.15.2.1. By Product
18.15.2.2. By End-use
18.15.2.3. By Type
18.15.3. Competition Landscape and Player Concentration in the Country
18.16. India Market Analysis
18.16.1. Value Proportion Analysis by Market Taxonomy
18.16.2. Volume (Tons), Value Analysis and Forecast by Market Taxonomy, 2018-2034
18.16.2.1. By Product
18.16.2.2. By End-use
18.16.2.3. By Type
18.16.3. Competition Landscape and Player Concentration in the Country
18.17. ASEAN Countries Market Analysis
18.17.1. Value Proportion Analysis by Market Taxonomy
18.17.2. Volume (Tons), Value Analysis and Forecast by Market Taxonomy, 2018-2034
18.17.2.1. By Product
18.17.2.2. By End-use
18.17.2.3. By Type
18.17.3. Competition Landscape and Player Concentration in the Country
18.18. Turkey Market Analysis
18.18.1. Value Proportion Analysis by Market Taxonomy
18.18.2. Volume (Tons), Value Analysis and Forecast by Market Taxonomy, 2018-2034
18.18.2.1. By Product
18.18.2.2. By End-use
18.18.2.3. By Type
18.18.3. Competition Landscape and Player Concentration in the Country
18.19. GCC Countries Market Analysis
18.19.1. Value Proportion Analysis by Market Taxonomy
18.19.2. Volume (Tons), Value Analysis and Forecast by Market Taxonomy, 2018-2034
18.19.2.1. By Product
18.19.2.2. By End-use
18.19.2.3. By Type
18.19.3. Competition Landscape and Player Concentration in the Country
19. Market Structure Analysis
19.1. Market Analysis by Tier of Companies
19.2. Market Concentration
19.3. Market Share Analysis of Top Players
19.4. Market Presence Analysis
19.4.1. By Regional footprint of Players
19.4.2. Product footprint by Players
19.4.3. Channel footprint by Players
20. Competition Analysis
20.1. Competition Dashboard
20.2. Competition Benchmarking
20.3. Competition Deep Dive (Indicative List)
20.3.1. Henkel AG Co. KGaA
20.3.1.1. Overview
20.3.1.2. Product Portfolio
20.3.1.3. Profitability by Market Segments (Product/Channel/Region)
20.3.1.4. Sales Footprint
20.3.1.5. Strategy Overview
20.3.2. 3M
20.3.2.1. Overview
20.3.2.2. Product Portfolio
20.3.2.3. Profitability by Market Segments (Product/Channel/Region)
20.3.2.4. Sales Footprint
20.3.2.5. Strategy Overview
20.3.3. DuPont de Nemours, Inc.
20.3.3.1. Overview
20.3.3.2. Product Portfolio
20.3.3.3. Profitability by Market Segments (Product/Channel/Region)
20.3.3.4. Sales Footprint
20.3.3.5. Strategy Overview
20.3.4. Sika AG
20.3.4.1. Overview
20.3.4.2. Product Portfolio
20.3.4.3. Profitability by Market Segments (Product/Channel/Region)
20.3.4.4. Sales Footprint
20.3.4.5. Strategy Overview
20.3.5. H.B. Fuller Company
20.3.5.1. Overview
20.3.5.2. Product Portfolio
20.3.5.3. Profitability by Market Segments (Product/Channel/Region)
20.3.5.4. Sales Footprint
20.3.5.5. Strategy Overview
20.3.6. Bostik
20.3.6.1. Overview
20.3.6.2. Product Portfolio
20.3.6.3. Profitability by Market Segments (Product/Channel/Region)
20.3.6.4. Sales Footprint
20.3.6.5. Strategy Overview
20.3.7. Huntsman International LLC
20.3.7.1. Overview
20.3.7.2. Product Portfolio
20.3.7.3. Profitability by Market Segments (Product/Channel/Region)
20.3.7.4. Sales Footprint
20.3.7.5. Strategy Overview
20.3.8. Avery Dennison Corporation
20.3.8.1. Overview
20.3.8.2. Product Portfolio
20.3.8.3. Profitability by Market Segments (Product/Channel/Region)
20.3.8.4. Sales Footprint
20.3.8.5. Strategy Overview
20.3.9. Illinois Tool Works Inc.
20.3.9.1. Overview
20.3.9.2. Product Portfolio
20.3.9.3. Profitability by Market Segments (Product/Channel/Region)
20.3.9.4. Sales Footprint
20.3.9.5. Strategy Overview
20.3.10. RPM International Inc.
20.3.10.1. Overview
20.3.10.2. Product Portfolio
20.3.10.3. Profitability by Market Segments (Product/Channel/Region)
20.3.10.4. Sales Footprint
20.3.10.5. Strategy Overview
20.3.11. Akzo Nobel N.V.
20.3.11.1. Overview
20.3.11.2. Product Portfolio
20.3.11.3. Profitability by Market Segments (Product/Channel/Region)
20.3.11.4. Sales Footprint
20.3.11.5. Strategy Overview
20.3.12. Ashland
20.3.12.1. Overview
20.3.12.2. Product Portfolio
20.3.12.3. Profitability by Market Segments (Product/Channel/Region)
20.3.12.4. Sales Footprint
20.3.12.5. Strategy Overview
20.3.13. KCC Corporation
20.3.13.1. Overview
20.3.13.2. Product Portfolio
20.3.13.3. Profitability by Market Segments (Product/Channel/Region)
20.3.13.4. Sales Footprint
20.3.13.5. Strategy Overview
20.3.14. Mapei S.p.A.
20.3.14.1. Overview
20.3.14.2. Product Portfolio
20.3.14.3. Profitability by Market Segments (Product/Channel/Region)
20.3.14.4. Sales Footprint
20.3.14.5. Strategy Overview
20.3.15. DELO Industrie Klebstoffe GmbH & Co. KGaA
20.3.15.1. Overview
20.3.15.2. Product Portfolio
20.3.15.3. Profitability by Market Segments (Product/Channel/Region)
20.3.15.4. Sales Footprint
20.3.15.5. Strategy Overview
20.3.16. Jowat SE
20.3.16.1. Overview
20.3.16.2. Product Portfolio
20.3.16.3. Profitability by Market Segments (Product/Channel/Region)
20.3.16.4. Sales Footprint
20.3.16.5. Strategy Overview
20.3.17. Yokohama Industries Americas Inc
20.3.17.1. Overview
20.3.17.2. Product Portfolio
20.3.17.3. Profitability by Market Segments (Product/Channel/Region)
20.3.17.4. Sales Footprint
20.3.17.5. Strategy Overview
20.3.18. Permabond LLC
20.3.18.1. Overview
20.3.18.2. Product Portfolio
20.3.18.3. Profitability by Market Segments (Product/Channel/Region)
20.3.18.4. Sales Footprint
20.3.18.5. Strategy Overview
20.3.19. Franklin International
20.3.19.1. Overview
20.3.19.2. Product Portfolio
20.3.19.3. Profitability by Market Segments (Product/Channel/Region)
20.3.19.4. Sales Footprint
20.3.19.5. Strategy Overview
20.3.20. LORD Corporation
20.3.20.1. Overview
20.3.20.2. Product Portfolio
20.3.20.3. Profitability by Market Segments (Product/Channel/Region)
20.3.20.4. Sales Footprint
20.3.20.5. Strategy Overview
21. Assumptions and Acronyms Used
22. Research Methodology
*** 本調査レポートに関するお問い合わせ ***