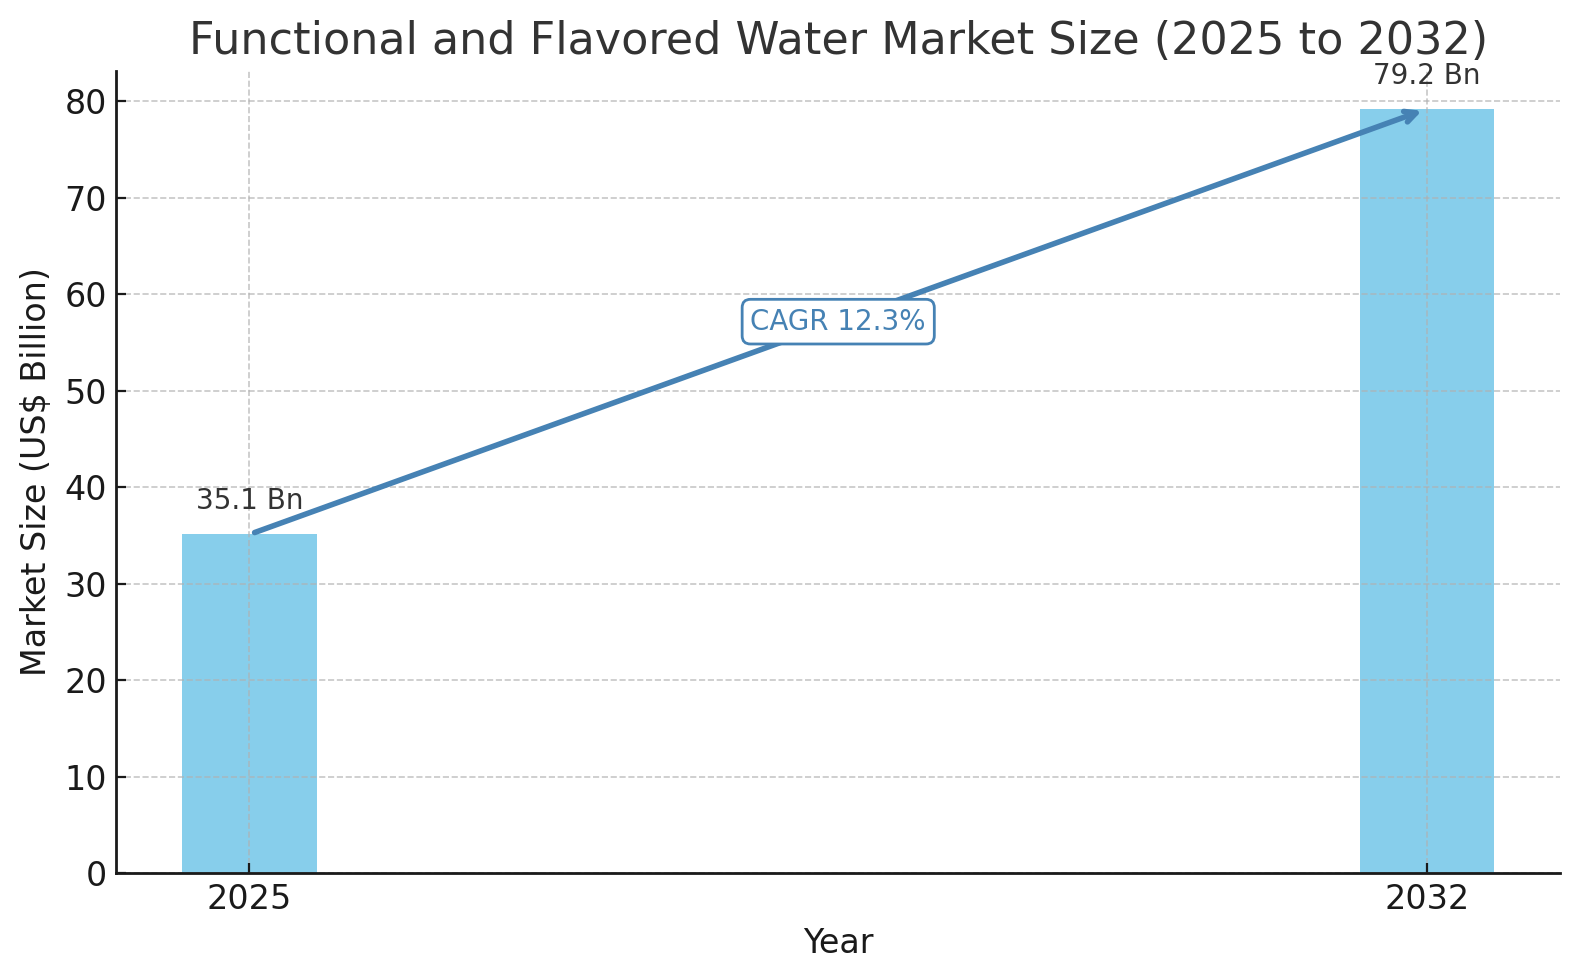
The global functional and flavored water market is expected to grow significantly, increasing from USD 35.1 billion in 2025 to approximately USD 79.2 billion by 2032, expanding at a robust compound annual growth rate (CAGR) of 12.3%. This projected expansion is driven by heightened consumer health consciousness, growing demand for low-calorie beverage alternatives, and a rising preference for enhanced hydration options. Between 2019 and 2024, the market recorded a CAGR of 8.2%, reaching USD 32.5 billion in 2024. As more consumers adopt wellness-focused lifestyles, flavored and functional water is becoming an essential substitute for traditional carbonated and sugary beverages.
Functional water is typically enriched with vitamins, minerals, electrolytes, herbs, or antioxidants, whereas flavored water incorporates natural or fruit-based flavorings without adding sugar or calories. The appeal lies in combining hydration with added health benefits, aligning with the demands of fitness-conscious and aging populations. The increase in urbanization, rising disposable incomes, and the expansion of modern retail formats also contribute to market acceleration. Functional and flavored waters are now seen as part of a broader healthy lifestyle movement, supported by influential marketing campaigns and growing product variety.
Consumer trends have shifted rapidly in favor of products perceived as natural, clean-label, and low in sugar. Health issues such as obesity, diabetes, and cardiovascular disorders have made many people reconsider their beverage choices. Functional and flavored water provides a convenient solution for consumers seeking both taste and nutrition. The trend is especially evident in urban centers where consumers are adopting preventive health measures and reducing consumption of synthetic beverages. Furthermore, younger consumers are especially drawn to refreshing flavored options, while older consumers prefer waters with added nutritional benefits.
Another contributing factor to market growth is the positioning of functional water within beauty and wellness routines. Many functional waters are now being marketed with cosmetic benefits such as improved skin hydration, detoxification, and anti-aging properties. In emerging economies, rising incomes are enabling consumers to explore premium health beverages that were previously unaffordable. This premiumization trend is especially prominent in countries experiencing environmental stressors such as water pollution, which has fueled packaged water consumption across Asia.
The taste factor also plays a key role in encouraging hydration. Flavored waters offer a sensory advantage over plain water, motivating consumers to drink more frequently throughout the day. Health professionals have noted that this increased fluid intake supports metabolic processes, weight management, and general wellness. This demand has led to increasing per capita consumption in developed and developing countries alike.
Nevertheless, the widespread use of plastic packaging presents a major challenge. Single-use plastic bottles are commonly used in this segment and have raised growing environmental concerns. Plastic waste, carbon footprints, and health risks associated with plastic leaching are under intense scrutiny. Regulatory restrictions and consumer pressure are pushing companies to adopt sustainable packaging alternatives, though the transition remains a gradual process.
Europe currently leads the global market, holding a 29.1% value share in 2024. France and Germany represent the largest national markets within the region, accounting for a combined one-third of Europe’s total consumption. The region benefits from high health literacy, widespread access to premium water products, and a supportive regulatory environment. North America follows as the second-largest regional market, contributing 22.3% of global revenue. Consumers in the U.S. and Canada are particularly responsive to health branding and low-sugar product claims. The rise of functional waters infused with electrolytes, probiotics, or vitamins is reshaping beverage shelves across the region.
Asia Pacific is emerging as the fastest-growing market, fueled by large-scale urbanization, changing dietary habits, and increased awareness of water quality. China, India, Japan, and South Korea are among the key contributors, with packaged water demand rising sharply due to pollution and health-related concerns. Latin America holds a relatively larger base than the Middle East and Africa, though the latter is projected to grow at a higher rate due to its evolving retail sector and rising wellness awareness.
Within product categories, functional water holds the largest market share and is expected to maintain its lead through 2032. The growth is attributed to innovations in formulation, health claims, and added benefits that align with specific lifestyle needs such as immunity boosting, digestive health, and energy enhancement. In contrast, flavored water continues to gain traction among consumers looking for taste variety without added sugars or calories.
In terms of distribution, hypermarkets and supermarkets dominate due to their extensive reach and high foot traffic. These outlets provide consumers with access to multiple brands and promotional offers. However, online retail is the fastest-growing sales channel, driven by the convenience of home delivery, subscription models, and a broader product assortment. E-commerce platforms are becoming especially relevant in urban and younger consumer segments.
The competitive landscape features a mix of multinational beverage corporations and agile start-ups. Leading players such as PepsiCo, Nestlé, Danone, The Coca-Cola Company, and Talking Rain Beverage Company are aggressively expanding their functional and flavored water portfolios. Product innovation is a key strategic focus, with efforts directed at enhancing taste, adding nutritional functionality, and transitioning to eco-friendly packaging.
Strategic partnerships and acquisitions are shaping the market’s trajectory. For instance, PepsiCo introduced Aquafina Sparkling to tap into the sparkling functional water segment, while Danone’s acquisition of Turkish water brand Sirma strengthened its regional presence. Coca-Cola formed a regional bottling alliance in Africa to streamline its distribution network. Nestlé Waters expanded its production facilities to meet growing demand for its Pure Life and flavored water lines.
As health and environmental consciousness continue to reshape consumer behavior, the functional and flavored water market is expected to grow in both volume and value. The sector’s long-term success will rely on balancing innovation with sustainability, affordability, and nutritional integrity. With rising global demand for healthy, convenient, and refreshing beverage options, functional and flavored water is poised to remain a key category in the wellness-oriented beverage landscape.
Functional and Flavored Water Industry Research by Category
By Product Type:
- Flavored Water
- Functional Water
By Sales Channel:
- Hypermarkets/Supermarkets
- Convenience Stores
- Specialty Stores
- Departmental Stores
- Online Retail
By Region:
- North America
- Latin America
- Europe
- South Asia & Pacific
- East Asia
- Middle East & Africa
Table of Content
1. Executive Summary
1.1. Global Market Outlook
1.2. Demand Side Trends
1.3. Supply Side Trends
1.4. Analysis and Recommendations
2. Market Overview
2.1. Market Coverage / Taxonomy
2.2. Market Definition / Scope / Limitations
3. Key Market Trends
3.1. Key Trends Impacting the Market
3.1.1. Evolving Consumers Preference for Healthy Beverages – 21st Century Trend
3.1.2. Consumers View Water as an Integral part of Daily Nutrition to Augment Sales of Flavored & Functional Waters
3.1.3. Retail sector to register exceptionally high demand for flavored and functional waters
3.1.4. Others
3.2. Product Innovation / Development Trends
4. Key Success Factors
4.1. Consumer Trends Shaping the Industry
4.1.1. Who is Consuming is Transforming
4.1.2. Where & What is Consumed is Evolving
4.1.3. Why it is Being Consumed is Changing
5. Key Regulations & Label Claims
5.1. Packaging & Labelling Regulations
5.2. Region & Country Specific Regulations
5.3. Label Claims
6. Global Flavored and Functional Water Market Demand Outlook, 2019 – 2032
6.1. Historical Market Volume (Tons) Analysis, 2019-2023
6.2. Current and Future Market Volume (Tons) Projections, 2024-2032
6.2.1. Y-o-Y Growth Trend Analysis
7. Global Flavored and Functional Water Market – Pricing Analysis
7.1. Regional Pricing Trend Analysis
7.2. Global Average Pricing Analysis Benchmark
8. Global Flavored and Functional Water Market Demand Outlook, 2019 – 2032
8.1. Historical Market Value (US$ Mn) Analysis, 2019-2023
8.2. Current and Future Market Value (US$ Mn) Projections, 2024-2032
8.2.1. Y-o-Y Growth Trend Analysis
8.2.2. Absolute $ Opportunity Analysis
9. Market Background
9.1. Macro-Economic Factors
9.1.1. Global GDP Growth Outlook
9.1.2. Global Industry Value Added
9.1.3. Global Urbanization Growth Outlook
9.1.4. Global Food Security Index Outlook
9.1.5. Global Rank – Ease of Doing Business
9.1.6. Global Rank – Trading Across Borders
9.2. Processing Technology Overview
9.3. Global Bottled Water Market Outlook
9.4. Forecast Factors – Relevance & Impact
9.5. Market Dynamics
9.5.1. Drivers
9.5.2. Restraints
9.5.3. Opportunity Analysis
9.6. Global Supply Demand Analysis
10. Global Flavored and Functional Water Market Outlook, 2019 – 2032
10.1. Introduction / Key Findings
10.2. Historical Market Size (US$ Mn) and Volume Analysis By Product Type, 2019-2023
10.3. Current and Future Market Size (US$ Mn) and Volume Analysis and Forecast By Product Type, 2024-2032
10.3.1. Flavored Water
10.3.2. Functional Water
10.4. Market Attractiveness Analysis By Product Type
11. Global Flavored and Functional Water Market Outlook, 2019 – 2032
11.1. Introduction / Key Findings
11.2. Historical Market Size (US$ Mn) and Volume Analysis By Sales Channel, 2019-2023
11.3. Current and Future Market Size (US$ Mn) and Volume Analysis and Forecast By Sales Channel, 2024-2032
11.3.1. Hypermarkets/Supermarkets
11.3.2. Convenience Stores
11.3.3. Specialty Stores
11.3.4. Departmental Stores
11.3.5. Online Retail
11.4. Market Attractiveness Analysis By Sales Channel
12. Global Flavored and Functional Water Market Outlook, 2019 – 2032
12.1. Introduction
12.2. Historical Market Size (US$ Mn) and Volume Analysis By Region, 2019-2023
12.3. Current Market Size (US$ Mn) and Volume Analysis and Forecast By Region, 2024-2032
12.3.1. North America
12.3.2. Latin America
12.3.3. Europe
12.3.4. Middle East and Africa (MEA)
12.3.5. East Asia
12.3.6. South Asia and Pacific
12.4. Market Attractiveness Analysis By Region
13. North America Flavored and Functional Water Market Outlook, 2019 – 2032
13.1. Introduction
13.2. Pricing Analysis
13.3. Historical Market Size (US$ Mn) and Volume Trend Analysis By Market Taxonomy, 2019-2023
13.4. Market Size (US$ Mn) and Volume Forecast By Market Taxonomy, 2024-2032
13.4.1. By Country
13.4.1.1. U.S.
13.4.1.2. Canada
13.4.2. By Type
13.4.3. By Sales Channel
13.5. Market Attractiveness Analysis
13.5.1. By Country
13.5.2. By Type
13.5.3. By Sales Channel
13.6. Market Trends
13.7. Key Market Participants – Intensity Mapping
13.8. Drivers and Restraints – Impact Analysis
14. Latin America Flavored and Functional Water Market Outlook, 2019 – 2032
14.1. Introduction
14.2. Pricing Analysis
14.3. Historical Market Size (US$ Mn) and Volume Trend Analysis By Market Taxonomy, 2019-2023
14.4. Market Size (US$ Mn) and Volume Forecast By Market Taxonomy, 2024-2032
14.4.1. By Country
14.4.1.1. Brazil
14.4.1.2. Mexico
14.4.1.3. Argentina
14.4.1.4. Chile
14.4.1.5. Rest of Latin America
14.4.2. By Type
14.4.3. By Sales Channel
14.5. Market Attractiveness Analysis
14.5.1. By Country
14.5.2. By Type
14.5.3. By Sales Channel
14.6. Market Trends
14.7. Key Market Participants – Intensity Mapping
14.8. Drivers and Restraints – Impact Analysis
15. Europe Flavored and Functional Water Market Outlook, 2019 – 2032
15.1. Introduction
15.2. Pricing Analysis
15.3. Historical Market Size (US$ Mn) and Volume Trend Analysis By Market Taxonomy, 2019-2023
15.4. Market Size (US$ Mn) and Volume Forecast By Market Taxonomy, 2024-2032
15.4.1. By Country
15.4.1.1. Germany
15.4.1.2. Italy
15.4.1.3. France
15.4.1.4. U.K.
15.4.1.5. Spain
15.4.1.6. BENELUX
15.4.1.7. Russia
15.4.1.8. Poland
15.4.1.9. Nordic
15.4.1.10. Rest of Europe
15.4.2. By Type
15.4.3. By Sales Channel
15.5. Market Attractiveness Analysis
15.5.1. By Country
15.5.2. By Type
15.5.3. By Sales Channel
15.6. Market Trends
15.7. Key Market Participants – Intensity Mapping
15.8. Drivers and Restraints – Impact Analysis
16. South Asia and Pacific Flavored and Functional Water Market Outlook, 2019 – 2032
16.1. Introduction
16.2. Pricing Analysis
16.3. Historical Market Size (US$ Mn) and Volume Trend Analysis By Market Taxonomy, 2019-2023
16.4. Market Size (US$ Mn) and Volume Forecast By Market Taxonomy, 2024-2032
16.4.1. By Country
16.4.1.1. India
16.4.1.2. ASEAN
16.4.1.3. Oceania
16.4.1.4. Rest of South Asia & Pacific
16.4.2. By Type
16.4.3. By Sales Channel
16.5. Market Attractiveness Analysis
16.5.1. By Country
16.5.2. By Type
16.5.3. By Sales Channel
16.6. Market Trends
16.7. Key Market Participants – Intensity Mapping
16.8. Drivers and Restraints – Impact Analysis
17. East Asia Flavored and Functional Water Market Outlook, 2019 – 2032
17.1. Introduction
17.2. Pricing Analysis
17.3. Historical Market Size (US$ Mn) and Volume Trend Analysis By Market Taxonomy, 2019-2023
17.4. Market Size (US$ Mn) and Volume Forecast By Market Taxonomy, 2024-2032
17.4.1. By Country
17.4.1.1. China
17.4.1.2. Japan
17.4.1.3. South Korea
17.4.2. By Type
17.4.3. By Sales Channel
17.5. Market Attractiveness Analysis
17.5.1. By Country
17.5.2. By Type
17.5.3. By Sales Channel
17.6. Market Trends
17.7. Key Market Participants – Intensity Mapping
17.8. Drivers and Restraints – Impact Analysis
18. Middle East and Africa Flavored and Functional Water Market Outlook, 2019 – 2032
18.1. Introduction
18.2. Pricing Analysis
18.3. Historical Market Size (US$ Mn) and Volume Trend Analysis By Market Taxonomy, 2019-2023
18.4. Market Size (US$ Mn) and Volume Forecast By Market Taxonomy, 2024-2032
18.4.1. By Country
18.4.1.1. GCC Countries
18.4.1.2. Turkey
18.4.1.3. Northern Africa
18.4.1.4. South Africa
18.4.1.5. Egypt
18.4.1.6. Israel
18.4.1.7. Rest of Middle East and Africa
18.4.2. By Type
18.4.3. By Sales Channel
18.5. Market Attractiveness Analysis
18.5.1. By Country
18.5.2. By Type
18.5.3. By Sales Channel
18.6. Market Trends
18.7. Key Market Participants – Intensity Mapping
18.8. Drivers and Restraints – Impact Analysis
19. Country Wise Flavored and Functional Water Market Outlook, 2019 – 2032
19.1. Introduction
19.1.1. Market Value Proportion Analysis, By Key Countries
19.1.2. Global Vs. Country Growth Comparison
19.2. U.S. Flavored and Functional Water Market Analysis
19.2.1. By Type
19.2.2. By Sales Channel
19.3. Canada Flavored and Functional Water Market Analysis
19.3.1. By Type
19.3.2. By Sales Channel
19.4. Mexico Flavored and Functional Water Market Analysis
19.4.1. By Type
19.4.2. By Sales Channel
19.5. Brazil Flavored and Functional Water Market Analysis
19.5.1. By Type
19.5.2. By Sales Channel
19.6. Argentina Flavored and Functional Water Market Analysis
19.6.1. By Type
19.6.2. By Sales Channel
19.7. Chile Flavored and Functional Water Market Analysis
19.7.1. By Type
19.7.2. By Sales Channel
19.8. Germany Flavored and Functional Water Market Analysis
19.8.1. By Type
19.8.2. By Sales Channel
19.9. Italy Flavored and Functional Water Market Analysis
19.9.1. By Type
19.9.2. By Sales Channel
19.10. France Flavored and Functional Water Market Analysis
19.10.1. By Type
19.10.2. By Sales Channel
19.11. U.K. Flavored and Functional Water Market Analysis
19.11.1. By Type
19.11.2. By Sales Channel
19.12. Spain Flavored and Functional Water Market Analysis
19.12.1. By Type
19.12.2. By Sales Channel
19.13. Russia Flavored and Functional Water Market Analysis
19.13.1. By Type
19.13.2. By Sales Channel
19.14. China Flavored and Functional Water Market Analysis
19.14.1. By Type
19.14.2. By Sales Channel
19.15. Japan Flavored and Functional Water Market Analysis
19.15.1. By Type
19.15.2. By Sales Channel
19.16. S. Korea Flavored and Functional Water Market Analysis
19.16.1. By Type
19.16.2. By Sales Channel
19.17. India Flavored and Functional Water Market Analysis
19.17.1. By Type
19.17.2. By Sales Channel
19.18. Turkey Flavored and Functional Water Market Analysis
19.18.1. By Type
19.18.2. By Sales Channel
19.19. South Africa Flavored and Functional Water Market Analysis
19.19.1. By Type
19.19.2. By Sales Channel
19.20. Israel Flavored and Functional Water Market Analysis
19.20.1. By Type
19.20.2. By Sales Channel
19.21. Egypt Flavored and Functional Water Market Analysis
19.21.1. By Type
19.21.2. By Sales Channel
20. Market Structure Analysis
20.1. Market Analysis by Tier of Companies (Flavored and Functional Water)
20.2. Market Share Analysis of Top Players
20.3. Market Presence Analysis
21. Competition Analysis
21.1. Competition Dashboard
21.2. Competition Benchmarking
21.3. Competition Deep Dive
21.3.1. Talking Rain Beverage Company
21.3.1.1. Overview
21.3.1.2. Product Portfolio
21.3.1.3. Profitability by Market Segments (Product/Channel/Region)
21.3.1.4. Sales Footprint
21.3.1.5. Strategy Overview
21.3.2. HINJ7
21.3.2.1. Overview
21.3.2.2. Product Portfolio
21.3.2.3. Profitability by Market Segments (Product/Channel/Region)
21.3.2.4. Sales Footprint
21.3.2.5. Strategy Overview
21.3.3. Propel
21.3.3.1. Overview
21.3.3.2. Product Portfolio
21.3.3.3. Profitability by Market Segments (Product/Channel/Region)
21.3.3.4. Sales Footprint
21.3.3.5. Strategy Overview
21.3.4. Bai Brands, LLC
21.3.4.1. Overview
21.3.4.2. Product Portfolio
21.3.4.3. Profitability by Market Segments (Product/Channel/Region)
21.3.4.4. Sales Footprint
21.3.4.5. Strategy Overview
21.3.5. Body Armor Nutrition LLC
21.3.5.1. Overview
21.3.5.2. Product Portfolio
21.3.5.3. Profitability by Market Segments (Product/Channel/Region)
21.3.5.4. Sales Footprint
21.3.5.5. Strategy Overview
21.3.6. San Pellecrino Essenza
21.3.6.1. Overview
21.3.6.2. Product Portfolio
21.3.6.3. Profitability by Market Segments (Product/Channel/Region)
21.3.6.4. Sales Footprint
21.3.6.5. Strategy Overview
21.3.7. Bubbly
21.3.7.1. Overview
21.3.7.2. Product Portfolio
21.3.7.3. Profitability by Market Segments (Product/Channel/Region)
21.3.7.4. Sales Footprint
21.3.7.5. Strategy Overview
21.3.8. JUST WATER
21.3.8.1. Overview
21.3.8.2. Product Portfolio
21.3.8.3. Profitability by Market Segments (Product/Channel/Region)
21.3.8.4. Sales Footprint
21.3.8.5. Strategy Overview
21.3.9. Lemon Perfect
21.3.9.1. Overview
21.3.9.2. Product Portfolio
21.3.9.3. Profitability by Market Segments (Product/Channel/Region)
21.3.9.4. Sales Footprint
21.3.9.5. Strategy Overview
21.3.10. Spindrift Beverage Co., Inc.
21.3.10.1. Overview
21.3.10.2. Product Portfolio
21.3.10.3. Profitability by Market Segments (Product/Channel/Region)
21.3.10.4. Sales Footprint
21.3.10.5. Strategy Overview
21.3.11. Perrier
21.3.11.1. Overview
21.3.11.2. Product Portfolio
21.3.11.3. Profitability by Market Segments (Product/Channel/Region)
21.3.11.4. Sales Footprint
21.3.11.5. Strategy Overview
21.3.12. Alkazone
21.3.12.1. Overview
21.3.12.2. Product Portfolio
21.3.12.3. Profitability by Market Segments (Product/Channel/Region)
21.3.12.4. Sales Footprint
21.3.12.5. Strategy Overview
21.3.13. CORE
21.3.13.1. Overview
21.3.13.2. Product Portfolio
21.3.13.3. Profitability by Market Segments (Product/Channel/Region)
21.3.13.4. Sales Footprint
21.3.13.5. Strategy Overview
21.3.14. Essentia Water Inc.
21.3.14.1. Overview
21.3.14.2. Product Portfolio
21.3.14.3. Profitability by Market Segments (Product/Channel/Region)
21.3.14.4. Sales Footprint
21.3.14.5. Strategy Overview
21.3.15. NESTLE SPLASH
21.3.15.1. Overview
21.3.15.2. Product Portfolio
21.3.15.3. Profitability by Market Segments (Product/Channel/Region)
21.3.15.4. Sales Footprint
21.3.15.5. Strategy Overview
21.3.16. Pepsi Co
21.3.16.1. Overview
21.3.16.2. Product Portfolio
21.3.16.3. Profitability by Market Segments (Product/Channel/Region)
21.3.16.4. Sales Footprint
21.3.16.5. Strategy Overview
21.3.17. AHA
21.3.17.1. Overview
21.3.17.2. Product Portfolio
21.3.17.3. Profitability by Market Segments (Product/Channel/Region)
21.3.17.4. Sales Footprint
21.3.17.5. Strategy Overview
21.3.18. The Coca-Cola Company
21.3.18.1. Overview
21.3.18.2. Product Portfolio
21.3.18.3. Profitability by Market Segments (Product/Channel/Region)
21.3.18.4. Sales Footprint
21.3.18.5. Strategy Overview
21.3.19. Groupe Danone
21.3.19.1. Overview
21.3.19.2. Product Portfolio
21.3.19.3. Profitability by Market Segments (Product/Channel/Region)
21.3.19.4. Sales Footprint
21.3.19.5. Strategy Overview
21.3.20. New York Spring Water.
21.3.20.1. Overview
21.3.20.2. Product Portfolio
21.3.20.3. Profitability by Market Segments (Product/Channel/Region)
21.3.20.4. Sales Footprint
21.3.20.5. Strategy Overview
21.3.21. KRAFT Foods
21.3.21.1. Overview
21.3.21.2. Product Portfolio
21.3.21.3. Profitability by Market Segments (Product/Channel/Region)
21.3.21.4. Sales Footprint
21.3.21.5. Strategy Overview
22. Assumptions and Acronyms Used
23. Research Methodology