Market Introduction
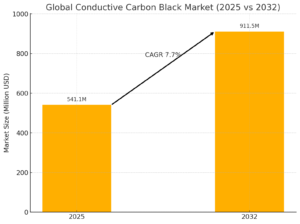
The global conductive carbon black market is positioned for robust growth over the forecast period of 2025 to 2032, with a projected Compound Annual Growth Rate (CAGR) of 7.7%. Persistence Market Research estimates the market value will reach approximately US$ 541.1 million by 2025 and expand further to US$ 909.5 million by 2032. This growth is driven by expanding applications across multiple industries and continuous production capacity enhancements by leading manufacturers.
Conductive carbon black, a highly refined form of carbon, is prized for its unique ability to enhance the mechanical and electrical properties of various materials. Its primary applications include reinforcing rubber, imparting conductivity to polymers, and enhancing durability and resistance properties in coatings and inks. Additionally, it is extensively used in the electronics sector, where it improves the conductivity of electrical components.
Historical Market Performance
Between 2019 and 2024, the conductive carbon black market experienced a moderate CAGR of 3.9%. Growth during this period was hampered by the global COVID-19 pandemic, which disrupted manufacturing operations, constrained supply chains, and significantly reduced demand across key end-use industries.
However, as global economies began to recover, demand for conductive carbon black rebounded strongly, particularly from sectors such as automotive, construction, paints and coatings, and electronics. This recovery established a firm foundation for the market’s accelerated growth trajectory forecasted for the 2025–2032 period.
Market Drivers
Rising Demand Across Application Segments
Conductive carbon black offers exceptional conductivity even at low concentrations, setting it apart from traditional carbon black. Its utility in applications such as electrical wire shielding, antistatic coatings, batteries, and thermoplastic composites is fueling market expansion. The rise in demand for electromagnetic interference (EMI) shielding materials, pressure sensors, and self-regulating heating materials is further driving consumption.
Research and Innovation as Growth Catalysts
Innovation is a critical growth lever. Manufacturers are actively developing new grades of conductive carbon black tailored for emerging applications. Initiatives such as tire recovery projects—where carbon black, oil, and steel are recovered—are gaining momentum. Furthermore, research into combining conductive carbon black with carbon nanotubes to improve electrode conductivity represents a promising avenue for expanding usage, especially in the energy storage sector.
Favorable Macroeconomic Trends
Investment in infrastructure, increased electric vehicle (EV) adoption, and growth in energy storage solutions globally are creating a conducive environment for conductive carbon black demand. These trends align with the broader transition toward sustainable and energy-efficient technologies.
Market Challenges
Competition from Alternative Materials
The emergence of alternatives such as silica, silicones, and bio-based lignin presents a significant threat to the conductive carbon black market. These alternatives offer improved environmental profiles and, in some cases, superior performance characteristics. For instance, ball-milled lignin has demonstrated higher surface area and conductivity than traditional conductive carbon black.
Health and Safety Concerns
Conductive carbon black poses potential health risks. Long-term exposure can irritate the respiratory tract, and it is classified as a possible human carcinogen. Occupational exposure limits impose restrictions, and increasing regulatory scrutiny could limit broader adoption in sensitive industries.
Application Analysis
Dominance of the Plastics Segment
The plastics segment is projected to maintain its dominance in terms of conductive carbon black consumption. Conductive carbon black enhances the static dissipation, UV resistance, and mechanical strength of plastic products used in automotive components, carrier boxes, tapes, trays, and packaging films. Its critical role in the manufacture of antistatic films, garbage bags, and insulation materials for wires and cables ensures sustained high demand in the plastics sector.
Regional Insights
United States: A Key Growth Market
The United States is expected to remain a significant contributor to the global conductive carbon black market, accounting for more than 20% of total sales by 2025. Post-pandemic economic recovery, coupled with investments in construction and battery manufacturing industries, is anticipated to drive demand. Additionally, higher operational costs, including the implementation of emission control systems, have contributed to price increases, making the market even more attractive for domestic production.
China: A Global Powerhouse
China remains a dominant player, contributing approximately 47% of East Asia’s conductive carbon black revenue. Despite recent challenges—such as decelerating automotive and construction industries and rising freight and production costs—China’s entrenched supply chains and manufacturing scale position it for strong recovery. Renewed domestic and international demand will likely support China’s leading role throughout the forecast period.
Germany: Leading in Europe
Germany stands out as the leading market within Europe. Its diversified industrial base, especially in automotive and manufacturing sectors, underpins strong demand for conductive carbon black. Germany is forecasted to offer significant absolute dollar opportunities between 2025 and 2032, reinforcing its strategic importance in the regional market landscape.
Competitive Landscape
The global conductive carbon black market is moderately consolidated, with the top 4–5 players controlling approximately 50–55% of market share. Major companies continue to focus on strategic initiatives such as capacity expansions, mergers and acquisitions, and technological advancements to strengthen their competitive positions.
Key Recent Developments:
-
Orion Engineered Carbon: In August 2021, Orion commenced construction of its second Chinese plant dedicated to specialty and high-performance carbon black, aiming to add 65–70 kilotons of capacity annually.
-
Imerys Graphite and Carbon: In October 2022, Imerys expanded its presence in India by opening a new plant in Andhra Pradesh, positioning itself to meet growing local demand.
Leading companies are investing aggressively in R&D, expanding regional footprints, and seeking partnerships to capture emerging opportunities, especially in rapidly industrializing regions such as South Asia and Latin America.
Future Opportunities
Automotive and EV Industry
The accelerating shift towards electric vehicles and hybrid mobility solutions will generate substantial new demand for conductive carbon black, particularly in battery electrodes and lightweight automotive components requiring EMI shielding.
Energy Storage Solutions
Expanding renewable energy installations and the need for advanced battery technologies present significant growth prospects. Conductive carbon black’s role in improving battery performance and lifespan will be increasingly vital.
Sustainable and Circular Economy Trends
Innovations focused on recycling and reusing conductive carbon black, such as recovered carbon black (rCB) from end-of-life tires, align with global sustainability goals. These developments are expected to open up new revenue streams and enhance the environmental appeal of conductive carbon black products.
Conclusion
The global conductive carbon black market is on a dynamic growth path, underpinned by robust demand across diverse industries, technological advancements, and favorable macroeconomic trends. While challenges related to competition from alternative materials and regulatory concerns persist, proactive innovation, strategic investments, and a focus on sustainable practices are expected to secure conductive carbon black’s pivotal role in the materials industry over the coming decade.
Table of Content
1. Executive Summary
1.1. Global Market Outlook
1.2. Demand Side Trends
1.3. Supply Side Trends
1.4. Technology Roadmap
1.5. Analysis and Recommendations
2. Market Overview
2.1. Market Coverage / Taxonomy
2.2. Market Definition / Scope / Limitations
3. Key Market Trends
3.1. Key Trends Impacting the Market
3.2. Product Innovation / Development Trends
4. Key Success Factors
4.1. Product Adoption / Usage Analysis
4.2. Product USPs / Features
4.3. Strategic Promotional Strategies
5. Global Market Demand Analysis 2019-2023 and Forecast, 2024-2032
5.1. Historical Market Volume (Tons) Analysis, 2019-2023
5.2. Current and Future Market Volume (Tons) Projections, 2024-2032
5.3. Y-o-Y Growth Trend Analysis
6. Global Market – Pricing Analysis
6.1. Regional Pricing Analysis by Product Application
6.2. Global Average Pricing Analysis Benchmark
7. Global Market Demand (in Value or Size in US$ Mn) Analysis 2019-2023 and Forecast, 2024-2032
7.1. Historical Market Value (US$ Mn) Analysis, 2019-2023
7.2. Current and Future Market Value (US$ Mn) Projections, 2024-2032
7.2.1. Y-o-Y Growth Trend Analysis
7.2.2. Absolute $ Opportunity Analysis
8. Market Background
8.1. Macro-Economic Factors
8.1.1. Global GDP Growth Outlook
8.1.2. Other Macro Economic Factors
8.2. Forecast Factors – Relevance & Impact
8.2.1. Plastic Market Analysis
8.2.2. Effects of Acquisitions & Mergers on Market
8.2.3. Growing Demand from Battery Manufacturers
8.2.4. Construction Industry Growth
8.2.5. Demand from Paints and Coating Industry
8.3. Value Chain
8.3.1. Raw Material Suppliers
8.3.2. Product Manufacturers
8.3.3. End Users
8.4. COVID-19 Crisis – Impact Assessment
8.4.1. Current Statistics
8.4.2. Short-Mid-Long Term Outlook
8.4.3. Likely Rebound
8.5. Market Dynamics
8.5.1. Drivers
8.5.2. Restraints
8.5.3. Opportunity Analysis
8.6. Global Supply Demand Analysis
8.7. Overview by Key Types
8.7.1. Acetylene Black
8.7.2. Ketjen Black
9. Global Market Outlook, 2019 – 2032, by Application
9.1. Introduction / Key Findings
9.2. Historical Market Size (US$ Mn) and Volume Analysis by Application, 2019-2023
9.3. Current and Future Market Size (US$ Mn) and Volume Analysis and Forecast by Application, 2024-2032
9.3.1. Plastic
9.3.2. Battery Electrode
9.3.3. Paints and Coatings
9.3.4. Rubber
9.3.5. Others
9.4. Market Attractiveness Analysis by Application
10. Global Conductive Carbon Black Market Outlook, 2019 – 2032, by Region
10.1. Introduction
10.2. Historical Market Size (US$ Mn) and Volume Analysis by Region, 2019-2023
10.3. Current Market Size (US$ Mn) and Volume Analysis and Forecast by Region, 2024-2032
10.3.1. North America
10.3.2. Latin America
10.3.3. Europe
10.3.4. East Asia
10.3.5. South Asia Pacific
10.3.6. Middle East and Africa
10.4. Market Attractiveness Analysis by Region
11. North America Market Outlook, 2019 – 2032
11.1. Introduction
11.2. Pricing Analysis
11.3. Historical Market Size (US$ Mn) and Volume Trend Analysis by Market Taxonomy, 2019-2023
11.4. Market Size (US$ Mn) and Volume Forecast by Market Taxonomy, 2024-2032
11.4.1. by Country
11.4.1.1. U.S.
11.4.1.2. Canada
11.4.2. by Application
11.5. Market Attractiveness Analysis
11.5.1. by Country
11.5.2. by Application
11.6. Market Trends
11.7. Key Market Participants – Intensity Mapping
11.8. Drivers and Restraints – Impact Analysis
12. Latin America Market Outlook, 2019 – 2032
12.1. Introduction
12.2. Pricing Analysis
12.3. Historical Market Size (US$ Mn) and Volume Trend Analysis by Market Taxonomy, 2019-2023
12.4. Market Size (US$ Mn) and Volume Forecast by Market Taxonomy, 2024-2032
12.4.1. by Country
12.4.1.1. Brazil
12.4.1.2. Mexico
12.4.1.3. Rest of Latin America
12.4.2. by Application
12.5. Market Attractiveness Analysis
12.5.1. by Country
12.5.2. by Application
12.6. Market Trends
12.7. Key Market Participants – Intensity Mapping
12.8. Drivers and Restraints – Impact Analysis
13. Europe Market Outlook, 2019 – 2032
13.1. Introduction
13.2. Pricing Analysis
13.3. Historical Market Size (US$ Mn) and Volume Trend Analysis by Market Taxonomy, 2019-2023
13.4. Market Size (US$ Mn) and Volume Forecast by Market Taxonomy, 2024-2032
13.4.1. by Country
13.4.1.1. Germany
13.4.1.2. Italy
13.4.1.3. France
13.4.1.4. U.K.
13.4.1.5. Spain
13.4.1.6. BENELUX
13.4.1.7. Russia
13.4.1.8. Rest of Europe
13.4.2. by Application
13.5. Market Attractiveness Analysis
13.5.1. by Country
13.5.2. by Application
13.6. Market Trends
13.7. Key Market Participants – Intensity Mapping
13.8. Drivers and Restraints – Impact Analysis
14. East Asia Market Outlook, 2019 – 2032
14.1. Introduction
14.2. Pricing Analysis
14.3. Historical Market Size (US$ Mn) and Volume Trend Analysis by Market Taxonomy, 2019-2023
14.4. Market Size (US$ Mn) and Volume Forecast by Market Taxonomy, 2024-2032
14.4.1. by Country
14.4.1.1. China
14.4.1.2. Japan
14.4.1.3. South Korea
14.4.2. by Application
14.5. Market Attractiveness Analysis
14.5.1. by Country
14.5.2. by Application
14.6. Market Trends
14.7. Key Market Participants – Intensity Mapping
14.8. Drivers and Restraints – Impact Analysis
15. South Asia and Pacific Market Outlook, 2019 – 2032
15.1. Introduction
15.2. Pricing Analysis
15.3. Historical Market Size (US$ Mn) and Volume Trend Analysis by Market Taxonomy, 2019-2023
15.4. Market Size (US$ Mn) and Volume Forecast by Market Taxonomy, 2024-2032
15.4.1. by Country
15.4.1.1. India
15.4.1.2. ASEAN
15.4.1.3. Australia and New Zealand
15.4.1.4. Rest of South Asia & Pacific
15.4.2. by Application
15.5. Market Attractiveness Analysis
15.5.1. by Country
15.5.2. by Application
15.6. Market Trends
15.7. Key Market Participants – Intensity Mapping
15.8. Drivers and Restraints – Impact Analysis
16. Middle East and Africa Market Outlook, 2019 – 2032
16.1. Introduction
16.2. Pricing Analysis
16.3. Historical Market Size (US$ Mn) and Volume Trend Analysis by Market Taxonomy, 2019-2023
16.4. Market Size (US$ Mn) and Volume Forecast by Market Taxonomy, 2024-2032
16.4.1. by Country
16.4.1.1. GCC Countries
16.4.1.2. Turkey
16.4.1.3. Northern Africa
16.4.1.4. South Africa
16.4.1.5. Rest of Middle East and Africa
16.4.2. by Application
16.5. Market Attractiveness Analysis
16.5.1. by Country
16.5.2. by Application
16.6. Market Trends
16.7. Key Market Participants – Intensity Mapping
16.8. Drivers and Restraints – Impact Analysis
17. Country-Wise Market Analysis 2024 to 2032
17.1. U.S. Market Analysis
17.1.1. by Application
17.2. Canada Market Analysis
17.2.1. by Application
17.3. Mexico Market Analysis
17.3.1. by Application
17.4. Brazil Market Analysis
17.4.1. by Application
17.5. Germany Market Analysis
17.5.1. by Application
17.6. Italy Market Analysis
17.6.1. by Application
17.7. France Market Analysis
17.7.1. by Application
17.8. U.K. Market Analysis
17.8.1. by Application
17.9. Spain Market Analysis
17.9.1. by Application
17.10. Russia Market Analysis
17.10.1. by Application
17.11. China Market Analysis
17.11.1. by Application
17.12. Japan Market Analysis
17.12.1. by Application
17.13. S. Korea Market Analysis
17.13.1. by Application
17.14. India Market Analysis
17.14.1. by Application
17.15. ASEAN Market Analysis
17.15.1. by Application
17.16. Australia and New Zealand Market Analysis
17.16.1. by Application
17.17. Turkey Market Analysis
17.17.1. by Application
17.18. South Africa Market Analysis
17.18.1. by Application
18. Market Structure Analysis
18.1. Market Analysis by Tier of Companies (Conductive Carbon Black)
18.2. Market Share Analysis of Top Players
18.3. Market Presence Analysis
19. Competition Analysis
19.1. Competition Dashboard
19.2. Competition Benchmarking
19.3. Competition Deep Dive
19.3.1. AkzoNobel N.V.
19.3.1.1. Overview
19.3.1.2. Product Portfolio
19.3.1.3. Profitability by Market Segments (Product/Channel/Region)
19.3.1.4. Sales Footprint
19.3.1.5. Strategy Overview
19.3.2. Orion Engineered Carbon
19.3.2.1. Overview
19.3.2.2. Product Portfolio
19.3.2.3. Profitability by Market Segments (Product/Channel/Region)
19.3.2.4. Sales Footprint
19.3.2.5. Strategy Overview
19.3.3. Cabot Corporation
19.3.3.1. Overview
19.3.3.2. Product Portfolio
19.3.3.3. Profitability by Market Segments (Product/Channel/Region)
19.3.3.4. Sales Footprint
19.3.3.5. Strategy Overview
19.3.4. Denka Company Ltd.
19.3.4.1. Overview
19.3.4.2. Product Portfolio
19.3.4.3. Profitability by Market Segments (Product/Channel/Region)
19.3.4.4. Sales Footprint
19.3.4.5. Strategy Overview
19.3.5. Tokai Carbon Co. Ltd.
19.3.5.1. Overview
19.3.5.2. Product Portfolio
19.3.5.3. Profitability by Market Segments (Product/Channel/Region)
19.3.5.4. Sales Footprint
19.3.5.5. Strategy Overview
19.3.6. Phillips Carbon Black Limited
19.3.6.1. Overview
19.3.6.2. Product Portfolio
19.3.6.3. Profitability by Market Segments (Product/Channel/Region)
19.3.6.4. Sales Footprint
19.3.6.5. Strategy Overview
19.3.7. Imerys Graphite and Carbon
19.3.7.1. Overview
19.3.7.2. Product Portfolio
19.3.7.3. Profitability by Market Segments (Product/Channel/Region)
19.3.7.4. Sales Footprint
19.3.7.5. Strategy Overview
19.3.8. Ampact Corporation
19.3.8.1. Overview
19.3.8.2. Product Portfolio
19.3.8.3. Profitability by Market Segments (Product/Channel/Region)
19.3.8.4. Sales Footprint
19.3.8.5. Strategy Overview
19.3.9. Birla Carbon
19.3.9.1. Overview
19.3.9.2. Product Portfolio
19.3.9.3. Profitability by Market Segments (Product/Channel/Region)
19.3.9.4. Sales Footprint
19.3.9.5. Strategy Overview
19.3.10. Asbury Corporation
19.3.10.1. Overview
19.3.10.2. Product Portfolio
19.3.10.3. Profitability by Market Segments (Product/Channel/Region)
19.3.10.4. Sales Footprint
19.3.10.5. Strategy Overview
19.3.11. Penta Carbon GmbH
19.3.11.1. Overview
19.3.11.2. Product Portfolio
19.3.11.3. Profitability by Market Segments (Product/Channel/Region)
19.3.11.4. Sales Footprint
19.3.11.5. Strategy Overview
19.3.12. Mitsubishi Chemical Corporation
19.3.12.1. Overview
19.3.12.2. Product Portfolio
19.3.12.3. Profitability by Market Segments (Product/Channel/Region)
19.3.12.4. Sales Footprint
19.3.12.5. Strategy Overview
20. Assumptions and Acronyms Used
21. Research Methodology
Report Purchase Information
| Attribute | Details |
|---|---|
| Report Price | USD 4,995 |
| Published Date | 28 April 2025 |
| Delivery Format | PDF & Excel |
| Number of Pages | 200 pages |
| Delivery Lead Time | Within 3 working days |
For direct email inquiries, please contact us at:
📩 mr@marketresearch.co.jp