Rare Earth Elements Market Overview
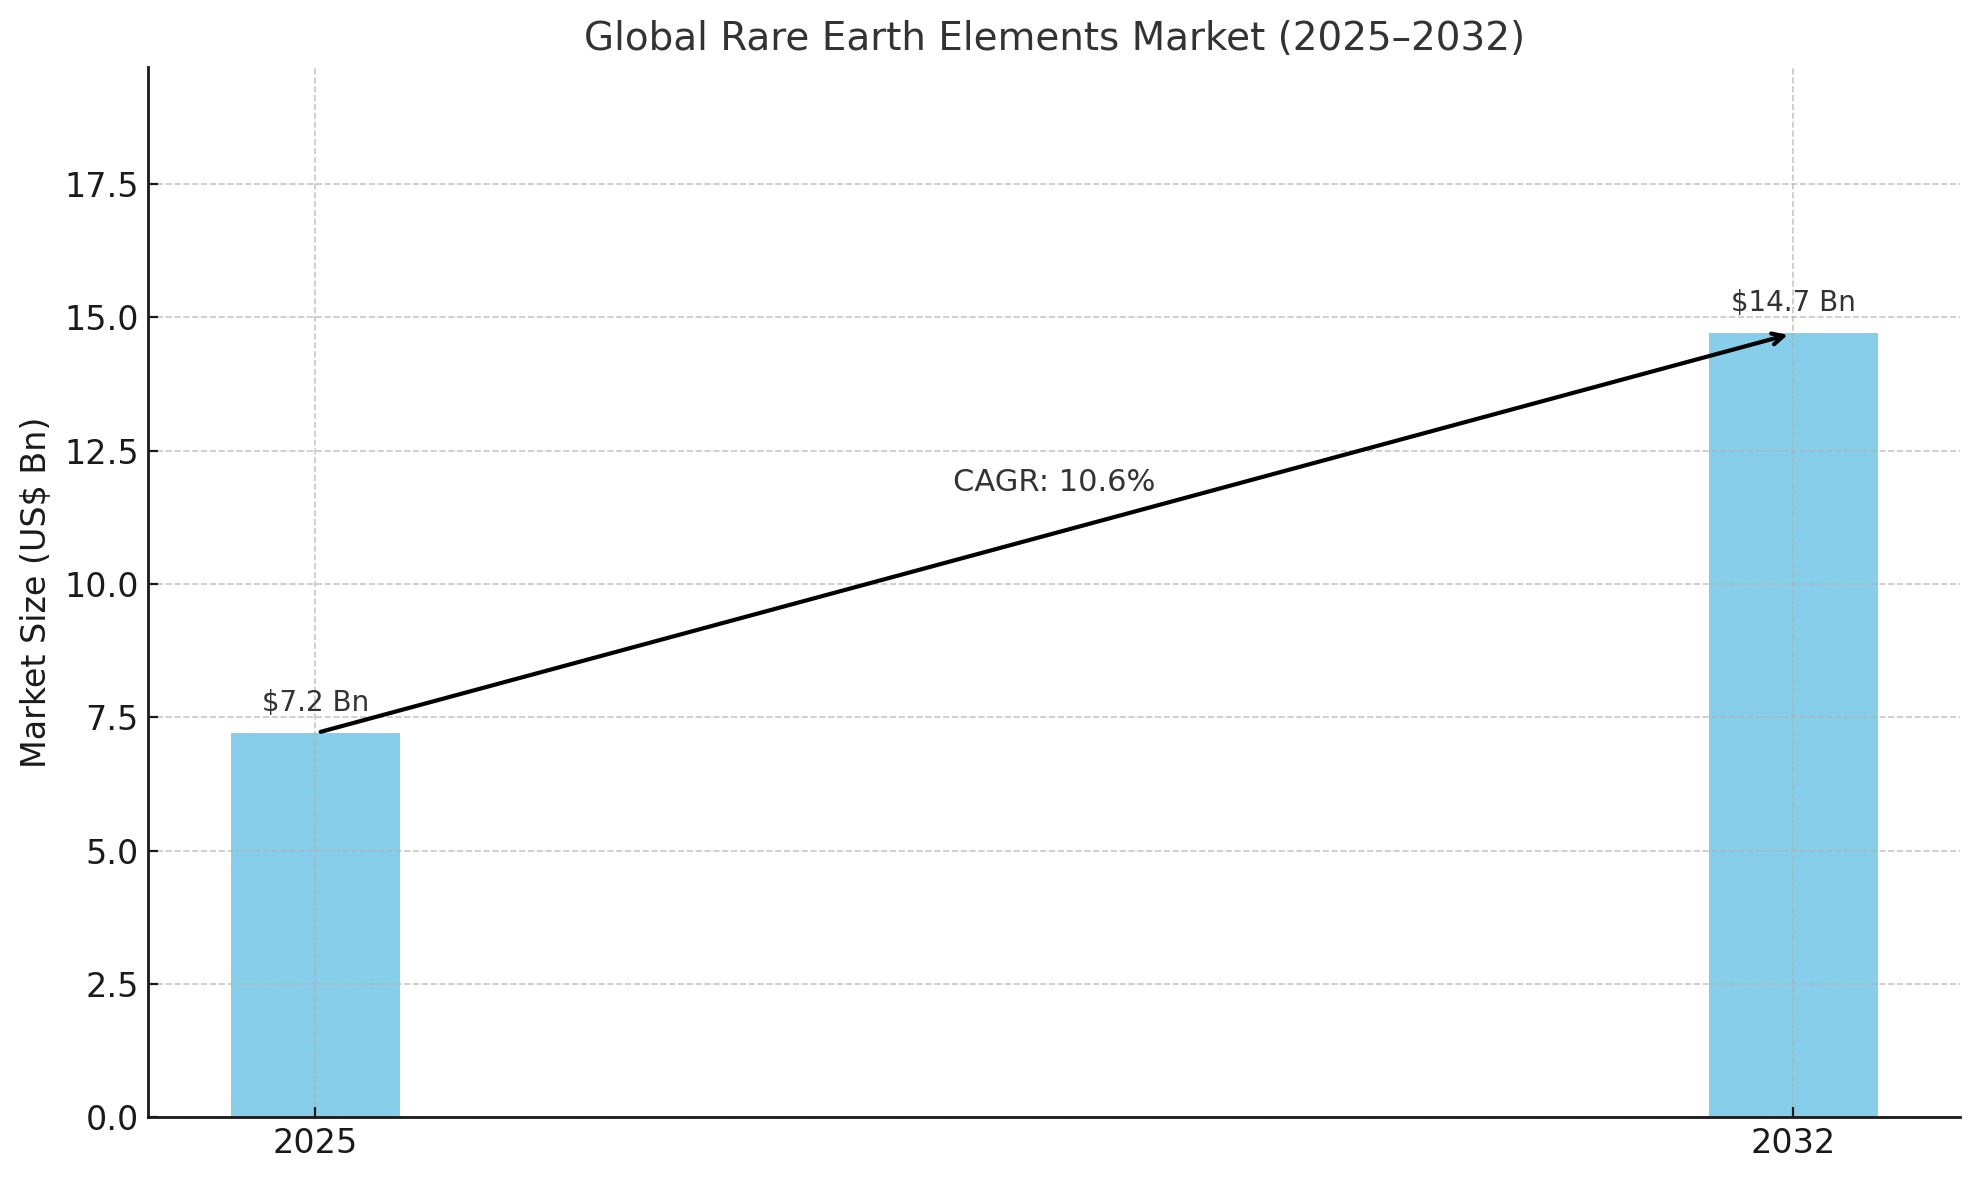
The global rare earth elements (REE) market is poised for significant growth, with the market size projected to expand from US$ 7.2 billion in 2025 to US$ 14.7 billion by 2032, reflecting a strong CAGR of 10.6%. This robust performance is underpinned by the increasing demand for REEs in advanced energy systems, particularly in the production of permanent magnets essential to electric vehicles (EVs), wind turbines, and other clean energy applications.
Rare earth elements, comprising a group of 17 chemically similar metals, have emerged as critical raw materials for modern technologies. Neodymium, praseodymium, dysprosium, and terbium are especially sought after due to their use in the production of high-performance magnets for next-generation vehicles and renewable energy infrastructure.
Market Drivers
One of the primary growth drivers is the global transition toward vehicle electrification. Permanent Magnet Synchronous Motors (PMSMs), which require REEs, are used in nearly 80% of all EVs. This transition is spurred by both consumer demand and government initiatives aimed at reducing carbon emissions and promoting sustainable transport.
For instance, global EV sales reached 17.1 million units in 2024, up 25% from 2023, and are expected to surpass 45 million units by 2030. This surge directly translates to increased demand for neodymium and other magnet-related REEs. Each EV may use between 2 to 5 kg of REE-based magnets, underlining the importance of these materials.
Wind energy is another major contributor to REE demand. Direct-drive wind turbines, which are more efficient and reliable, rely heavily on permanent magnets containing REEs. A single turbine can require 1–2 tons of Neodymium-Iron-Boron magnets per megawatt. As global wind capacity is forecast to reach 228 GW by 2030, demand for REEs in clean energy will continue to rise.
Key Trends and Insights
Light rare earth elements (LREEs), such as neodymium and lanthanum, dominate the market. In 2025, the LREE segment is projected to be valued at US$ 6.0 billion, continuing to grow due to applications in magnets, catalysts, and metallurgy. Lanthanum, the second-most prevalent REE, plays a crucial role in batteries and optical applications.
Recycling is emerging as a critical strategy to address supply limitations. Currently, only 1% of REEs are recycled, but increasing investments in this area are promising. Companies such as Cyclic Materials and Noveon Magnetics are pioneering closed-loop systems that recover REEs from waste electronics and industrial products, contributing to sustainable and ethical sourcing.
Regional Dynamics
Asia Pacific leads the global REE market, with China accounting for over 70% of total production and 90% of permanent magnet manufacturing. China’s dominance is supported by state-sponsored initiatives, restrictions on export technology, and investments in advanced recovery methods that yield 95% extraction efficiency. Japan and India are strengthening their positions through joint ventures and strategic investments.
Europe is heavily dependent on Chinese imports, sourcing 98% of its REEs from the country. To mitigate this dependency, countries like Sweden and Spain are investing in local extraction and processing projects. Sweden’s LKAB, for example, launched a rare earth oxide plant projected to supply up to 18% of the region’s demand by 2026.
North America, particularly the U.S., holds significant reserves but lacks the processing capabilities to meet domestic demand. MP Materials operates the only active REE mine in the U.S., and the defense sector is a key consumer. Each F-35 fighter jet, for instance, requires up to 400 kg of REEs. Despite this, about 78% of REEs used in the U.S. are imported from China, raising concerns about supply chain security.
Market Challenges
Price volatility remains the most significant challenge for the REE industry. Between 2019 and 2023, prices fluctuated dramatically due to supply constraints and geopolitical tensions. Heavy REEs like terbium saw price increases of over 76% due to scarcity and growing demand in high-tech applications. Such volatility deters long-term investment and complicates planning for OEMs and governments alike.
Additionally, the complex and environmentally sensitive nature of REE extraction presents sustainability concerns. Most REE ores are mixed with radioactive elements, requiring advanced technologies for safe processing and disposal. This has intensified efforts to develop green extraction and recycling solutions.
Competitive Landscape and Future Outlook
The REE market remains largely monopolized by Chinese firms such as China Minmetals Rare Earth Co. Ltd and Xiamen Tungsten Co. Ltd, though international players are gaining momentum. Australian firm Lynas Rare Earths and U.S.-based MP Materials are expanding operations, and new entrants are innovating with eco-friendly technologies.
Strategic investments are transforming the industry. In 2025, Australia’s National Reconstruction Fund invested AUD 200 million in Arafura Rare Earths’ Nolans Project, which is expected to supply 4% of the global NdPr demand by 2032. In India, the launch of the country’s first REE magnet production plant by Trafalgar signals a shift toward domestic value creation.
Emerging technologies, policy support, and global efforts to decouple from China’s supply chain dominance are reshaping the landscape. Projects in Brazil, South Africa, and Canada are also expected to play key roles in the decentralization of global REE supply.
Conclusion
The rare earth elements market is transitioning from a niche industry to a strategic pillar underpinning the global energy and mobility transformation. From electrified vehicles and wind turbines to military systems and smart devices, REEs are indispensable for the future. Despite challenges like price volatility and geopolitical dependencies, innovation in recycling, mining, and sustainable sourcing presents new opportunities for market players and governments alike.
As the world accelerates toward net-zero emissions and clean energy commitments, rare earth elements will remain at the heart of technological advancement and global industrial strategies.
Rare Earth Elements Industry Segmentation
By Product Type
- Neodymium
- Praseodymium
- Cerium
- Dysprosium
- Lanthanum
- Europium
- Terbium
- Yttrium
- Gadolinium
- Others
By Application
- Permanent Magnet
- Catalyst
- Glass and Ceramics
- Metallurgy and Alloys
- Phosphors
- Others
By Sector
- Automotive
- Clean Energy
- Oil and Gas
- Electronics
- Healthcare
- Others
By Region
- North America
- Europe
- East Asia
- South Asia and Oceania
- Middle East and Africa
- Latin America
Table of Content
1. Executive Summary
1.1. Global Rare Earth Elements Market Snapshot, 2025 and 2032
1.2. Market Opportunity Assessment, 2025 – 2032, US$ Mn
1.3. Key Market Trends
1.4. Future Market Projections
1.5. Premium Market Insights
1.6. Industry Developments and Key Market Events
1.7. PMR Analysis and Recommendations
2. Market Overview
2.1. Market Scope and Definition
2.2. Market Dynamics
2.2.1. Drivers
2.2.2. Restraints
2.2.3. Opportunity
2.2.4. Challenges
2.2.5. Key Trends
2.3. Macro-Economic Factors
2.3.1. Global Sectorial Outlook
2.3.2. Global GDP Growth Outlook
2.3.3. Global Mining spending Outlook
2.4. COVID-19 Impact Analysis
2.5. Forecast Factors – Relevance and Impact
3. Value Added Insights
3.1. Product Adoption Analysis
3.2. Technology Assessment
3.3. Regulatory Landscape
3.4. Value Chain Analysis
3.4.1. List of Raw Material Supplier
3.4.2. List of Manufacturers
3.4.3. List of Distributors
3.4.4. Profitability Analysis
3.5. Key Deals and Mergers
3.6. PESTLE Analysis
3.7. Porter’s Five Force Analysis
3.8. Geopolitical Tensions: Market Impact
4. Price Trend Analysis, 2019 – 2032
4.1. Key Highlights
4.2. Key Factors Impacting Product Prices
4.3. Pricing Analysis, By Product type
4.4. Regional Prices and Product Preferences
5. Global Rare Earth Elements Market Outlook: Historical (2019 – 2024) and Forecast (2025 – 2032)
5.1. Market Size (US$ Mn) Analysis and Forecast
5.1.1. Historical Market Size Analysis, 2019-2024
5.1.2. Current Market Size Forecast, 2025-2032
5.2. Global Rare Earth Elements Market Outlook: Product Type
5.2.1. Introduction / Key Findings
5.2.2. Historical Market Size (US$ Mn) Analysis By Product Type, 2019 – 2024
5.2.3. Current Market Size (US$ Mn) Forecast By Product Type, 2025 – 2032
5.2.3.1. Lanthanum
5.2.3.2. Cerium
5.2.3.3. Neodynium
5.2.3.4. Samarium
5.2.3.5. Praseodymium
5.2.3.6. Yttrium
5.2.3.7. Dysprosium
5.2.3.8. Gadolinium
5.2.3.9. Terbium
5.2.3.10. Erbium
5.2.3.11. Miscellaneous
5.3. Market Attractiveness Analysis: Product Type
5.4. Global Rare Earth Elements Market Outlook: Applications
5.4.1. Introduction / Key Findings
5.4.2. Historical Market Size (US$ Mn) Analysis By Applications, 2019 – 2024
5.4.3. Current Market Size (US$ Mn) Forecast By Applications, 2025 – 2032
5.4.3.1. Magnets
5.4.3.2. Catalysts
5.4.3.3. Metallurgy
5.4.3.4. Polishing Powders
5.4.3.5. Phosphors
5.4.3.6. Ceramics
5.4.3.7. Batteries
5.4.3.8. Misc.
5.5. Market Attractiveness Analysis: Applications
6. Global Rare Earth Elements Market Outlook: Region
6.1. Key Highlights
6.2. Historical Market Size (US$ Mn) Analysis, By Region, 2019 – 2024
6.3. Current Market Size (US$ Mn) Forecast, By Region, 2025 – 2032
6.3.1. North America
6.3.2. Europe
6.3.3. East Asia
6.3.4. South Asia and Oceania
6.3.5. Latin America
6.3.6. Middle East & Africa
6.4. Market Attractiveness Analysis: Region
7. North America Rare Earth Elements Market Outlook: Historical (2019 – 2024) and Forecast (2025 – 2032)
7.1. Key Highlights
7.2. Pricing Analysis
7.3. Historical Market Size (US$ Mn) Analysis, By Market, 2019 – 2024
7.3.1. By Country
7.3.2. By Product Type
7.3.3. By Applications
7.4. Current Market Size (US$ Mn) Analysis and Forecast, By Country, 2025 – 2032
7.4.1. U.S.
7.4.2. Canada
7.5. Current Market Size (US$ Mn) Analysis and Forecast, By Product Type, 2025 – 2032
7.5.1. Lanthanum
7.5.2. Cerium
7.5.3. Neodynium
7.5.4. Samarium
7.5.5. Praseodymium
7.5.6. Yttrium
7.5.7. Dysprosium
7.5.8. Gadolinium
7.5.9. Terbium
7.5.10. Erbium
7.5.11. Miscellaneous
7.6. Current Market Size (US$ Mn) Analysis and Forecast, By Applications, 2025 – 2032
7.6.1. Magnets
7.6.2. Catalysts
7.6.3. Metallurgy
7.6.4. Polishing Powders
7.6.5. Phosphors
7.6.6. Ceramics
7.6.7. Batteries
7.6.8. Misc.
7.7. Market Attractiveness Analysis
8. Europe Rare Earth Elements Market Outlook: Historical (2019 – 2024) and Forecast (2025 – 2032)
8.1. Key Highlights
8.2. Pricing Analysis
8.3. Historical Market Size (US$ Mn) and Volume (Units) Analysis, By Market, 2019 – 2024
8.3.1. By Country
8.3.2. By Product Type
8.3.3. By Applications
8.4. Current Market Size (US$ Mn) Analysis and Forecast, By Country, 2025 – 2032
8.4.1. Germany
8.4.2. France
8.4.3. U.K.
8.4.4. Italy
8.4.5. Spain
8.4.6. Russia
8.4.7. Türkiye
8.4.8. Rest of Europe
8.5. Current Market Size (US$ Mn) Analysis and Forecast, By Product Type, 2025 – 2032
8.5.1. Lanthanum
8.5.2. Cerium
8.5.3. Neodynium
8.5.4. Samarium
8.5.5. Praseodymium
8.5.6. Yttrium
8.5.7. Dysprosium
8.5.8. Gadolinium
8.5.9. Terbium
8.5.10. Erbium
8.5.11. Miscellaneous
8.6. Current Market Size (US$ Mn) Analysis and Forecast, By Applications, 2025 – 2032
8.6.1. Magnets
8.6.2. Catalysts
8.6.3. Metallurgy
8.6.4. Polishing Powders
8.6.5. Phosphors
8.6.6. Ceramics
8.6.7. Batteries
8.6.8. Misc.
8.7. Market Attractiveness Analysis
9. East Asia Rare Earth Elements Market Outlook: Historical (2019 – 2024) and Forecast (2025 – 2032)
9.1. Key Highlights
9.2. Pricing Analysis
9.3. Historical Market Size (US$ Mn) and Volume (Units) Analysis, By Market, 2019 – 2024
9.3.1. By Country
9.3.2. By Product Type
9.3.3. By Applications
9.4. Current Market Size (US$ Mn) Analysis and Forecast, By Country, 2025 – 2032
9.4.1. China
9.4.2. Japan
9.4.3. South Korea
9.5. Current Market Size (US$ Mn) Analysis and Forecast, By Product Type, 2025 – 2032
9.5.1. Lanthanum
9.5.2. Cerium
9.5.3. Neodynium
9.5.4. Samarium
9.5.5. Praseodymium
9.5.6. Yttrium
9.5.7. Dysprosium
9.5.8. Gadolinium
9.5.9. Terbium
9.5.10. Erbium
9.5.11. Miscellaneous
9.6. Current Market Size (US$ Mn) Analysis and Forecast, By Applications, 2025 – 2032
9.6.1. Magnets
9.6.2. Catalysts
9.6.3. Metallurgy
9.6.4. Polishing Powders
9.6.5. Phosphors
9.6.6. Ceramics
9.6.7. Batteries
9.6.8. Misc.
9.7. Market Attractiveness Analysis
10. South Asia & Oceania Rare Earth Elements Market Outlook: Historical (2019 – 2024) and Forecast (2025 – 2032)
10.1. Key Highlights
10.2. Pricing Analysis
10.3. Historical Market Size (US$ Mn) and Volume (Units) Analysis, By Market, 2019 – 2024
10.3.1. By Country
10.3.2. By Product Type
10.3.3. By Applications
10.4. Current Market Size (US$ Mn) Analysis and Forecast, By Product Type, 2025 – 2032
10.4.1. Lanthanum
10.4.2. Cerium
10.4.3. Neodynium
10.4.4. Samarium
10.4.5. Praseodymium
10.4.6. Yttrium
10.4.7. Dysprosium
10.4.8. Gadolinium
10.4.9. Terbium
10.4.10. Erbium
10.4.11. Miscellaneous
10.5. Current Market Size (US$ Mn) Analysis and Forecast, By Applications, 2025 – 2032
10.5.1. Magnets
10.5.2. Catalysts
10.5.3. Metallurgy
10.5.4. Polishing Powders
10.5.5. Phosphors
10.5.6. Ceramics
10.5.7. Batteries
10.5.8. Misc.
10.6. Market Attractiveness Analysis
11. Latin America Rare Earth Elements Market Outlook: Historical (2019 – 2024) and Forecast (2025 – 2032)
11.1. Key Highlights
11.2. Pricing Analysis
11.3. Historical Market Size (US$ Mn) and Volume (Units) Analysis, By Market, 2019 – 2024
11.3.1. By Country
11.3.2. By Product Type
11.3.3. By Applications
11.4. Current Market Size (US$ Mn) Analysis and Forecast, By Country, 2025 – 2032
11.4.1. Brazil
11.4.2. Mexico
11.4.3. Rest of Latin America
11.5. Current Market Size (US$ Mn) Analysis and Forecast, By Product Type, 2025 – 2032
11.5.1. Lanthanum
11.5.2. Cerium
11.5.3. Neodynium
11.5.4. Samarium
11.5.5. Praseodymium
11.5.6. Yttrium
11.5.7. Dysprosium
11.5.8. Gadolinium
11.5.9. Terbium
11.5.10. Erbium
11.5.11. Miscellaneous
11.6. Current Market Size (US$ Mn) Analysis and Forecast, By Applications, 2025 – 2032
11.6.1. Magnets
11.6.2. Catalysts
11.6.3. Metallurgy
11.6.4. Polishing Powders
11.6.5. Phosphors
11.6.6. Ceramics
11.6.7. Batteries
11.6.8. Misc.
11.7. Market Attractiveness Analysis
12. Middle East & Africa Rare Earth Elements Market Outlook: Historical (2019 – 2024) and Forecast (2025 – 2032)
12.1. Key Highlights
12.2. Pricing Analysis
12.3. Historical Market Size (US$ Mn) and Volume (Units) Analysis, By Market, 2019 – 2024
12.3.1. By Country
12.3.2. By Product Type
12.3.3. By Applications
12.4. Current Market Size (US$ Mn) Analysis and Forecast, By Country, 2025 – 2032
12.4.1. GCC Countries
12.4.2. Egypt
12.4.3. South Africa
12.4.4. Northern Africa
12.4.5. Rest of Middle East & Africa
12.5. Current Market Size (US$ Mn) Analysis and Forecast, By Product Type, 2025 – 2032
12.5.1. Lanthanum
12.5.2. Cerium
12.5.3. Neodynium
12.5.4. Samarium
12.5.5. Praseodymium
12.5.6. Yttrium
12.5.7. Dysprosium
12.5.8. Gadolinium
12.5.9. Terbium
12.5.10. Erbium
12.5.11. Miscellaneous
12.6. Current Market Size (US$ Mn) Analysis and Forecast, By Applications, 2025 – 2032
12.6.1. Magnets
12.6.2. Catalysts
12.6.3. Metallurgy
12.6.4. Polishing Powders
12.6.5. Phosphors
12.6.6. Ceramics
12.6.7. Batteries
12.6.8. Misc.
12.7. Market Attractiveness Analysis
13. Competition Landscape
13.1. Market Share Analysis, 2024
13.2. Market Structure
13.2.1. Competition Intensity Mapping By Market
13.2.2. Competition Dashboard
13.3. Company Profiles (Details – Overview, Financials, Strategy, Recent Developments)
13.3.1. Lynas Rare Earth Ltd
13.3.1.1. Overview
13.3.1.2. Segments and Products
13.3.1.3. Key Financials
13.3.1.4. Market Developments
13.3.1.5. Market Strategy
13.3.2. China Rare Earth Holding Ltd
13.3.2.1. Overview
13.3.2.2. Segments and Products
13.3.2.3. Key Financials
13.3.2.4. Market Developments
13.3.2.5. Market Strategy
13.3.3. Jiangxi Copper Co. Ltd
13.3.3.1. Overview
13.3.3.2. Segments and Products
13.3.3.3. Key Financials
13.3.3.4. Market Developments
13.3.3.5. Market Strategy
13.3.4. China Minmetals Rare Earth Co. Ltd
13.3.4.1. Overview
13.3.4.2. Segments and Products
13.3.4.3. Key Financials
13.3.4.4. Market Developments
13.3.4.5. Market Strategy
13.3.5. Xiamen Tungsten Co. Ltd
13.3.5.1. Overview
13.3.5.2. Segments and Products
13.3.5.3. Key Financials
13.3.5.4. Market Developments
13.3.5.5. Market Strategy
13.3.6. Guangdong Rare Earth Industry Grp Co Ltd
13.3.6.1. Overview
13.3.6.2. Segments and Products
13.3.6.3. Key Financials
13.3.6.4. Market Developments
13.3.6.5. Market Strategy
13.3.7. Grinm Advanced Materials Co Ltd
13.3.7.1. Overview
13.3.7.2. Segments and Products
13.3.7.3. Key Financials
13.3.7.4. Market Developments
13.3.7.5. Market Strategy
13.3.8. MP Materials
13.3.8.1. Overview
13.3.8.2. Segments and Products
13.3.8.3. Key Financials
13.3.8.4. Market Developments
13.3.8.5. Market Strategy
13.3.9. Shenghe Resources holding Co. Ltd
13.3.9.1. Overview
13.3.9.2. Segments and Products
13.3.9.3. Key Financials
13.3.9.4. Market Developments
13.3.9.5. Market Strategy
13.3.10. IREL Ltd
13.3.10.1. Overview
13.3.10.2. Segments and Products
13.3.10.3. Key Financials
13.3.10.4. Market Developments
13.3.10.5. Market Strategy
14. Appendix
14.1. Research Methodology
14.2. Research Assumptions
14.3. Acronyms and Abbreviations
Report Purchase Information
| Attribute | Details |
|---|---|
| Report Price | USD 4,995 |
| Published Date | 3 April 2025 |
| Delivery Format | PDF & Excel |
| Number of Pages | 180 pages |
| Delivery Lead Time | Within 3 working days |
For direct email inquiries, please contact us at:
📩 mr@marketresearch.co.jp